An AI answer now stands between your content and most of the people searching for it. 58.5% of US Google searches end without a single click. AI Overviews appear on 48% of tracked queries after growing 58% in twelve months (BrightEdge, February 2026). And in Google’s AI Mode, 93% of sessions end without one visit to the open web (Semrush).
The same data holds the upside. Brands cited inside AI answers earn 35% more organic clicks and 91% more paid clicks than uncited brands on the very same results page (Seer Interactive, 25.1M impressions). And the average AI search visitor converts at 4.4x the rate of a traditional organic visitor (Semrush). Clicks are scarcer. The clicks that survive are worth more. Winning them is a different job than the one SEO teams are trained for.
The 130+ AI SEO statistics below map that job in full: the zero-click baseline, click-through damage measured by four independent studies, citation data broken down by industry, country, and platform, and the off-page signals that predict AI visibility three times better than backlink counts. Every number carries its study name, date, and sample size.
One more reason to read past the headline stats: the two largest AI citation studies ever run, 25 million links versus 11.84 billion, reach conclusions that sound like opposites. Nearly everyone quotes one and ignores the other. Both are below, reconciled, because the answer decides where your off-page budget should actually go.
The short version of everything below: AI systems cite brands they see discussed across the web, and off-site signals now predict AI visibility about 3x better than raw link counts. If your brand needs mentions, citations, and links that AI engines actually trust, that is exactly what we build.
→ Explore AI-Era Link Building at LinkscopeKey AI SEO Statistics for 2026 (Editors’ Picks)
If you only need a citable number for a deck or an article, start here. These are the twelve highest-confidence findings in the dataset, chosen for methodology quality rather than shock value.
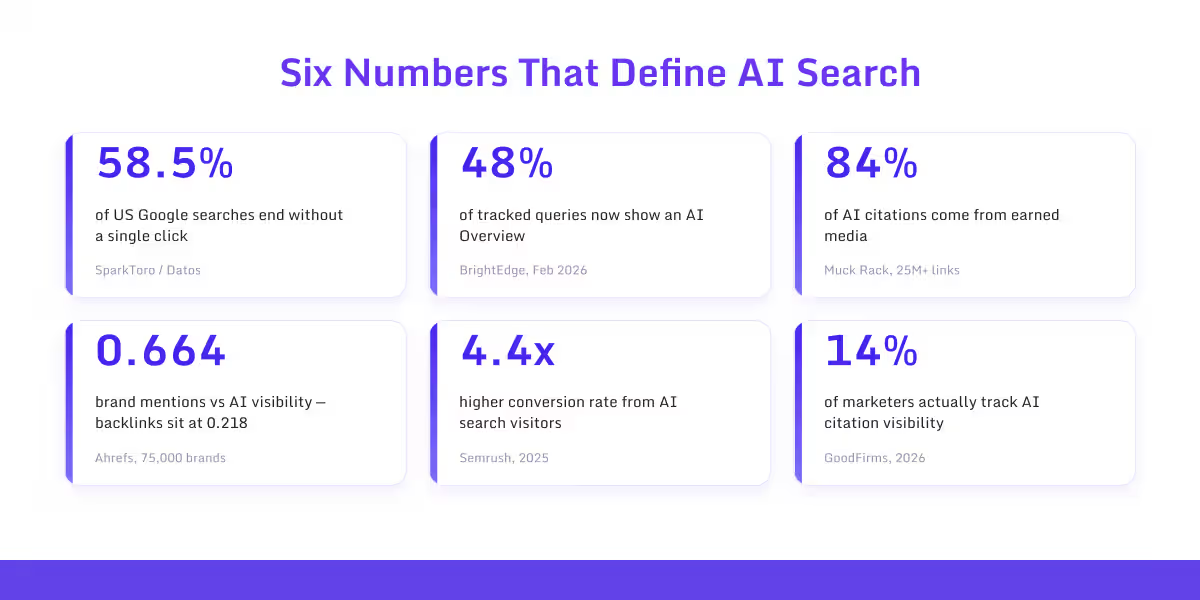
- ➜ 58.5% of US Google searches end without a click to the open web (SparkToro/Datos, clickstream panel, 2024).
- ➜ AI Overviews appear on roughly 48% of tracked queries, up 58% year over year (BrightEdge, February 2026).
- ➜ Users click a traditional result on just 8% of visits when an AI summary appears, versus 15% without one (Pew Research Center, 68,879 real searches, July 2025).
- ➜ 84% of all AI citations come from earned media; paid and advertorial content accounts for 0.3% (Muck Rack, 25M+ links, May 2026).
- ➜ Branded web mentions correlate with AI Overview visibility at 0.664; backlinks sit at 0.218 (Ahrefs, 75,000 brands, 2025).
- ➜ Only 17% of AI Overview citations now come from pages ranking in the organic top 10, down from roughly 76% in late 2024 (BrightEdge, February 2026).
- ➜ The average AI search visitor converts at 4.4x the rate of a traditional organic visitor (Semrush, 2025).
- ➜ AI referral traffic grew 527% year over year across 19 GA4 properties (Previsible via Search Engine Land, 2025).
- ➜ 91% of marketers now actively use AI in their work, up from 63% a year earlier (Jasper State of AI Marketing, 2026).
- ➜ Only 14% of marketers track AI or LLM citation visibility, despite 43% calling AI optimization a core 2026 strategy (GoodFirms practitioner survey, n=100+, early 2026).
- ➜ 93% of sessions in Google’s AI Mode end without a single external click (Semrush, September 2025).
- ➜ 99.9% of keywords that trigger AI Overviews are informational in intent (Ahrefs).
Zero-Click Search: The Baseline Everything Else Sits On
Zero-click search predates AI. Featured snippets, knowledge panels, and People Also Ask boxes were already answering queries on the results page. What AI Overviews changed is the scale and the type of query being resolved without a visit.
The most methodologically sound baseline comes from SparkToro and Datos, who analyzed a clickstream panel covering millions of US users. Their numbers, plus the AI-era acceleration data, look like this:
- ➜ For every 1,000 US Google searches, only 360 clicks reach the open web (SparkToro/Datos, 2024).
- ➜ On mobile, the zero-click rate reaches 77% (SparkToro/Datos, 2024).
- ➜ Zero-click searches rose from 56% to 69% between May 2024 and May 2025, a 13-point jump that maps directly onto the AI Overview rollout (Similarweb, 2025).
- ➜ 83% of searches that trigger an AI Overview end without a click (Bain and Dynata consumer survey, December 2024).
- ➜ 80% of consumers now rely on zero-click results in at least 40% of their searches (Bain, December 2024).
- ➜ 93% of Google AI Mode sessions end with zero external clicks on desktop (Semrush, September 2025).
- ➜ Gartner predicted in February 2024 that traditional search volume would fall 25% by 2026 as AI chatbots absorb query share. The 2025 and 2026 traffic data suggest the direction was right, and possibly conservative for some verticals.
- ➜ 94% of all web pages receive zero traffic from Google at all (Ahrefs), a reminder that the click pool was already brutally concentrated before AI arrived.
The AI Mode number deserves its own sentence. AI Mode does not place organic results next to an AI answer. It replaces them with a conversation. For queries that flow through it, classic rankings have no reach unless your brand earns a citation inside the response. That shift is why Google’s ranking systems are no longer the whole visibility story.
AI Overview Growth: The Year-Over-Year Picture
AI Overviews went from experiment to default surface in about two years. The growth numbers below come from Google’s own announcements and from BrightEdge’s Generative Parser, which has tracked AIO presence monthly since early 2025.
- ➜ AI Overviews reach more than 2.5 billion monthly users across 200+ countries (Google CEO Sundar Pichai, via CNBC, May 2026).
- ➜ Google AI Mode passed 1 billion monthly active users globally as of May 2026 (Google, via Search Engine Journal).
- ➜ AI Mode reached 100 million monthly actives within months of launch, a 4x jump from its May 2025 debut (Google).
- ➜ The average AI Mode search is three times longer than a traditional search, and more than one in six AI Mode searches in the US uses voice or images (Google AI Mode insights report).
- ➜ Brainstorming queries from US users grew 30% faster than queries overall after AI Mode launched (Google).
- ➜ AI Overview presence grew from roughly 30% to 48% of tracked queries between February 2025 and February 2026, a 58% rise (BrightEdge).
- ➜ Semrush’s separate keyword dataset shows the volatility: AIOs triggered on 6.49% of keywords in January 2025, peaked near 25% in July, then settled at 15.69% by November 2025.
- ➜ Conductor’s 21.9 million query analysis found AIOs on 25.11% of searches in 2026, up from 13.14% in March 2025.
- ➜ Mobile AI Overview presence grew 474.9% year over year (SEOClarity).
- ➜ Desktop AIO appearance in the US rose roughly 492% from September 2024 to September 2025 (SEOclarity).
- ➜ A typical AI Overview now averages more than 1,200 pixels tall, pushing organic results fully below the fold on a standard screen (BrightEdge, 2026).
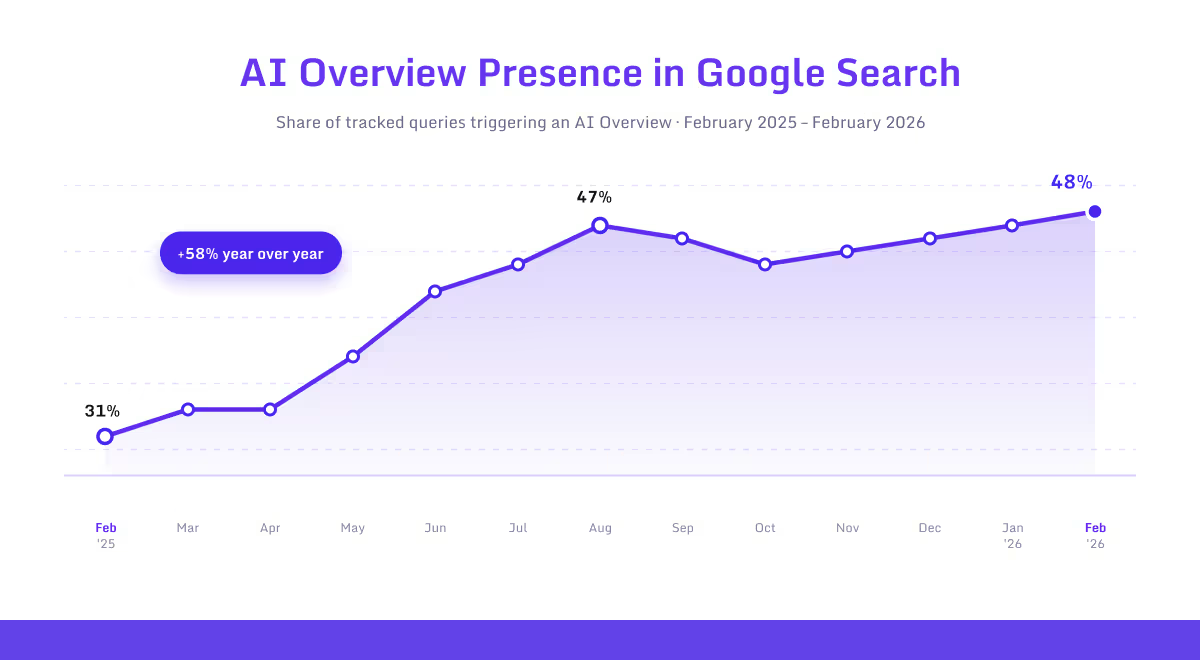
Notice the three trackers disagree on the absolute level: 15.69%, 25.11%, and 48%. They are not measuring the same thing. Each tool tracks a different keyword universe with different intent mixes, and informational-heavy sets trigger far more AIOs. Keep that in mind whenever a single prevalence number gets quoted to you.
What AI Overviews Did to Click-Through Rates
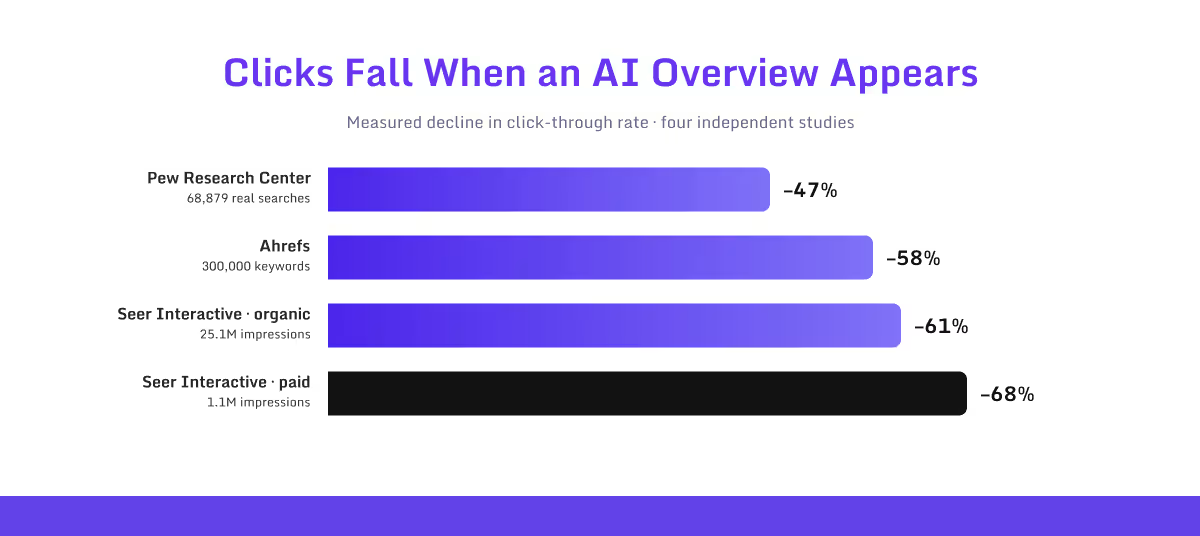
Every independent study measuring CTR when an AI Overview is present has found a decline. The magnitude varies with methodology, but across a dozen analyses the direction is unanimous. Here are the four most rigorous datasets.
| Study | Finding | Method |
|---|---|---|
| Pew Research Center, Jul 2025 | 8% CTR with AIO vs 15% without (47% relative drop) | 68,879 real searches, 900 US adults tracked |
| Ahrefs, Dec 2025 | 58% drop in position-1 organic CTR | 300,000 keywords, GSC aggregate data |
| Seer Interactive, Nov 2025 | Organic CTR fell 61% (1.76% to 0.61%) | 25.1M impressions, 42 organizations |
| Seer Interactive, Nov 2025 | Paid CTR fell 68% (19.7% to 6.34%) | 1.1M paid impressions, same panel |
| Amsive | 15.49% average CTR decline across query types | 700,000 keywords |
Beyond the headline drops, Pew’s behavioral data contains three findings that get far less attention than they deserve:
- ➜ Only 1% of users who saw an AI summary clicked a link inside it (Pew, July 2025).
- ➜ 26% of searches with an AI summary resulted in the user abandoning their browsing session entirely, compared to 16% without one (Pew). That traffic did not go to a competitor. It left the web.
- ➜ Even queries without an AI Overview saw a 41% decline in organic CTR year over year (Seer Interactive). The disruption extends past the queries where AIOs appear.
Ahrefs’ own figure moved from a 34.5% drop in April 2025 to 58% by December 2025, which is the year-over-year story in one stat: the click penalty is deepening, not stabilizing.
There is an upside-down case too. Brands cited inside an AI Overview earn 35% more organic clicks and 91% more paid clicks than non-cited brands on the same SERP (Seer Interactive).
Why the CTR studies disagree, and why that is fine
Pew tracked what real people did across all their searches. Ahrefs measured keyword-level CTR for the top position. Seer measured query-level CTR over 15 months. Three different objects, three different numbers, one direction. Treat the range, 47% to 68%, as the honest answer.
One caveat worth knowing before you quote Pew in a boardroom: Google formally disputes the study’s methodology, arguing the analysis window overlapped with unrelated algorithm testing. Pew’s remains the only large-scale study built on actual browsing behavior rather than keyword-tool estimates, so I cite it with that caveat attached.
AI SEO Statistics by Country and Language
Almost every AI SEO statistics roundup treats the US as the whole world. The regional data says otherwise, and if you run international campaigns, it changes where your AI visibility risk actually sits.
Ahrefs analyzed 108 million AI Overview queries across its Brand Radar index and ranked 50 countries by how often AIOs appear. The leader is not who you would guess:
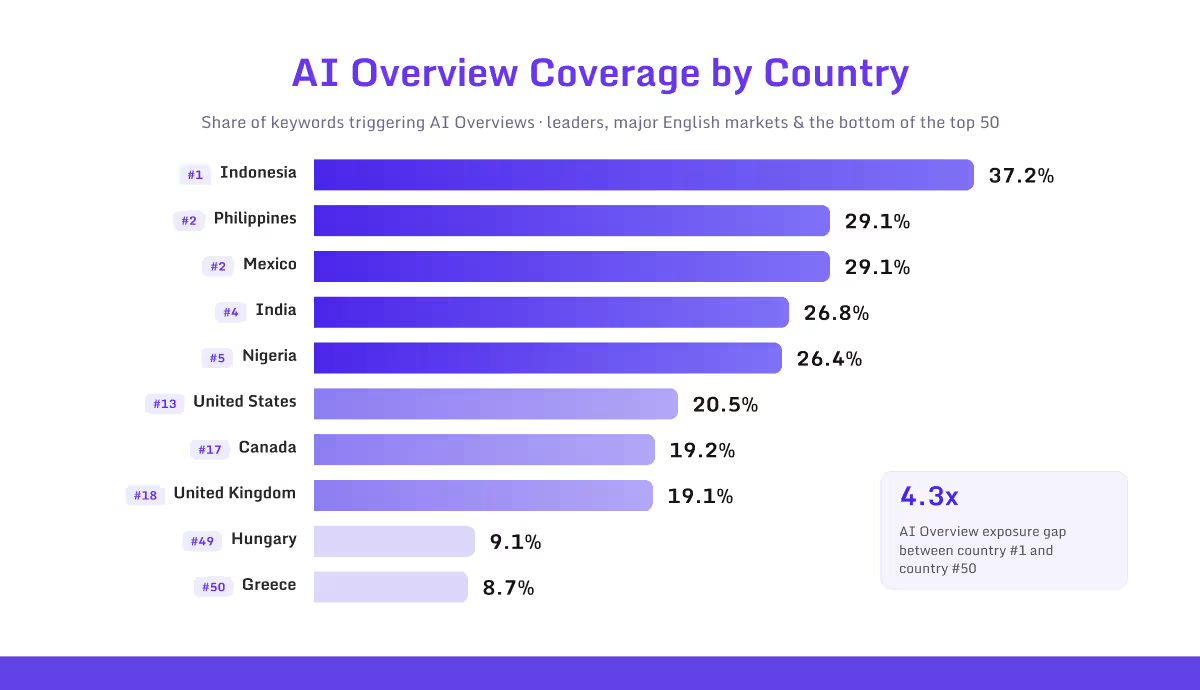
- ➜ Indonesia leads the world with AI Overviews on 37.2% of all keywords (Ahrefs, 108M queries).
- ➜ The Philippines and Mexico tie at 29.1%, followed by India at 26.8% and Nigeria at 26.4%.
- ➜ The United States ranks 13th at 20.5% coverage. Canada (19.2%) and the UK (19.1%) sit 17th and 18th.
- ➜ Hungary (9.1%) and Greece (8.7%) close out the top 50, meaning AIO exposure varies more than 4x between markets.
- ➜ English accounts for 52.75% of all AI Overviews worldwide. Spanish is second at 11.48%, then Portuguese (5.01%), Japanese (4.37%), and German (3.82%) (Ahrefs).
Query language rewires the citation graph itself. Profound’s March 2026 analysis of 3.25 billion citations across 14 countries found the same model citing drastically different source types depending on prompt language.
- ➜ Social sources appear at wildly different rates even within one company’s models: 15.3% of citations in Google AI Overviews versus 3.6% in Gemini (Profound, March 2026).
- ➜ In the EU, only 360 of every 1,000 Google searches produce an open-web click, mirroring the US figure almost exactly (SparkToro/Datos).
The practical read: if your market is Indonesia, the Philippines, or India, AI Overviews already intercept more of your queries than they do for a US brand. Emerging-market SEO teams are living in the future the US is still forecasting.
AI SEO Statistics by Industry
AI Overview rollout is not uniform. It is largely a YMYL story. Google pushed AI answers hardest into verticals where informational, consensus-based answers are easy to synthesize, and pulled back where transactions and ad revenue live.
BrightEdge’s Generative Parser tracked nine industries continuously from February 2025 to February 2026. The year-over-year deltas are the most revealing dataset in this entire topic:
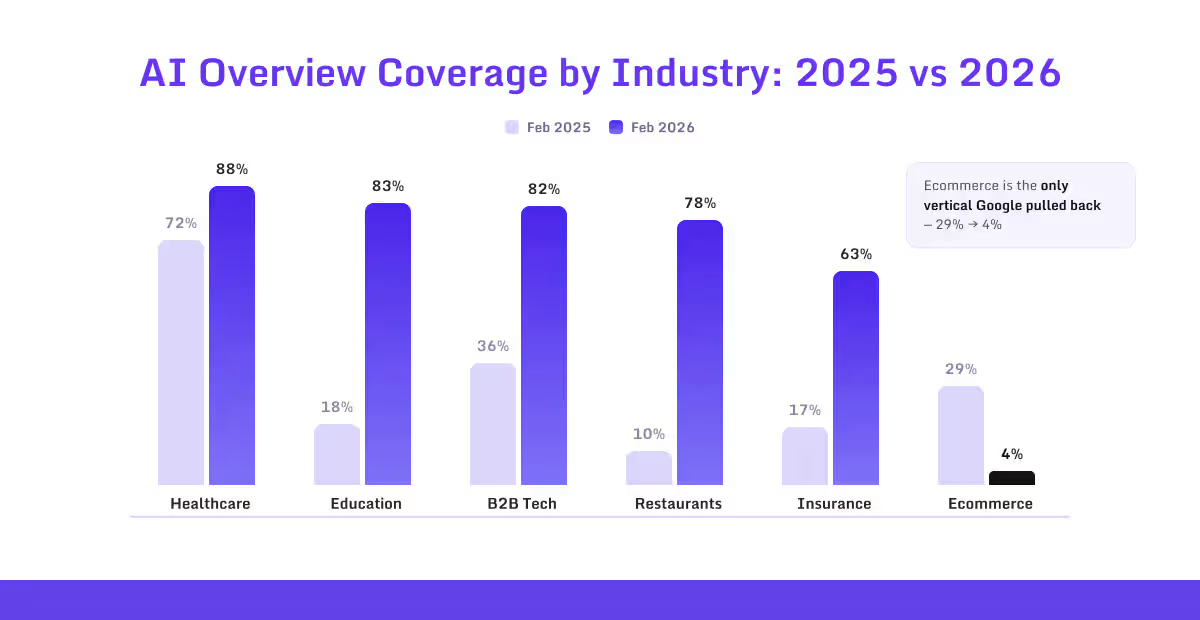
- ➜ Healthcare queries trigger AI Overviews 88% of the time, up from 72% a year earlier (BrightEdge, Feb 2025 to Feb 2026).
- ➜ Education jumped from 18% to 83% coverage, a 361% increase, and the steepest climb of any vertical.
- ➜ B2B technology, which includes SaaS and cybersecurity, rose from 36% to 82%.
- ➜ Restaurants went from 10% to 78%. Insurance climbed from 17% to roughly 63%.
- ➜ Ecommerce moved the opposite direction, collapsing from 29% coverage in 2024 to roughly 4% (BrightEdge, February 2026).
- ➜ Real estate has low saturation at 5.8% of queries, but grew 258% in 2025, making it the vertical to watch (Ahrefs, November 2025).
- ➜ By topic category, the highest AIO share belongs to Science (43.6%), Health (43.0%), Pets and Animals (36.8%), and People and Society (35.3%). The lowest: Shopping (3.2%), Real Estate (5.8%), Sports (14.8%), and News (15.1%) (Ahrefs).
- ➜ Citation overlap with organic rankings also varies by industry. Healthcare shows the highest overlap between AIO citations and the organic top 10 at 24%; finance shows just 11.3% (BrightEdge, 2026).
- ➜ Entertainment’s overlap jumped from 3.2% to 18.5% in a year, and travel’s from 5.7% to 17.7%, showing Google actively re-weighting sources per vertical (BrightEdge).
The ecommerce collapse is the most commercially strategic number here. Google is protecting transactional query revenue from AI summarization while letting low-monetization informational verticals go almost fully AI-answered.
If you sell SaaS, the calculus is different again, which is why we cover it separately in our guide to SaaS link building.
Where AI Citations Actually Come From (Two Studies That Disagree)
The two largest citation studies ever run reach conclusions that sound like opposites, and most of the industry quotes one as a settled fact without ever mentioning the other. Both are right. The reconciliation matters more than either headline, because it tells you which off-page channel deserves your budget.
The case for earned media: Muck Rack’s 25 million links
- ➜ Muck Rack’s Generative Pulse analyzed 25M+ links cited by ChatGPT, Claude, and Gemini across 17 industries. Earned media accounts for 84% of all AI citations (May 2026).
- ➜ Paid and advertorial content represent just 0.3% of citations. Journalism alone accounts for 27%.
- ➜ The finding has held across all three study editions since July 2025, ranging between 82% and 89%. That consistency suggests structure, not noise.
- ➜ McKinsey’s consumer research points the same way: a brand’s own website makes up only 5 to 10% of the sources AI search references (McKinsey, August 2025, n=1,927).
- ➜ AirOps found brands are 6.5x more likely to be cited in AI answers through third-party sources than through their own domains (2025).
The counter-finding: Profound’s 11.84 billion citations
Then, on July 30, 2026, Profound published the largest citation dataset in existence: 11.84 billion citations across eight models and 29 industries, swept April through July 2026, with a domain classification map covering 98.3% of global citation volume. Its headline cuts the other way:
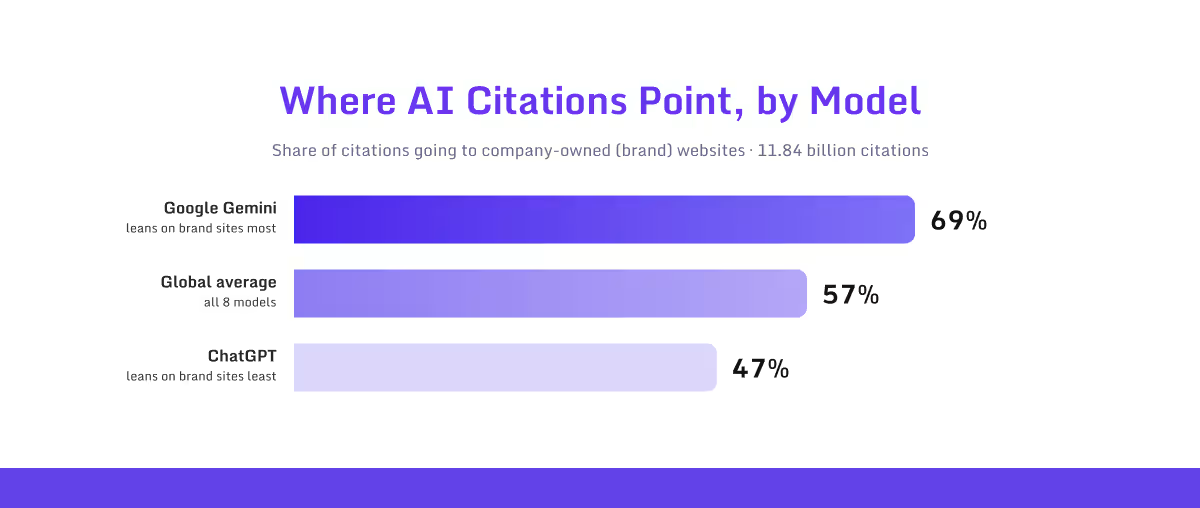
- ➜ Roughly 57% of all AI citations globally point to brand sites, meaning company-owned properties like corporate sites, product pages, docs, and brand blogs (Profound, July 2026).
- ➜ In 24 of 29 industries, the median brand gets more citations from brand sites than from earned or social sources combined.
- ➜ ChatGPT relies on brand sites least, at 47% of citations. Gemini relies on them most, at 69%.
Why both are true, and what to actually do with that
The studies define their buckets differently. Muck Rack folds third-party corporate content into earned media. Profound counts any company-owned property as a brand citation, including your competitors’ sites. They also ran different prompt sets against different model lineups.
Read together, the honest conclusion is that citation mix is industry-specific and model-specific, not universal. Profound’s own industry breakdown proves it:
- ➜ Pharma and biotech pull 59% of their citations from earned media, the highest of any industry (Profound).
- ➜ SaaS and software companies pull just 11.4% from earned media, the polar opposite.
- ➜ Cybersecurity is the most brand-cited industry at a 74% median brand share. Government and nonprofit sits at 15.9%.
- ➜ Fashion draws 16.5% of citations from social platforms; pharma draws only 5%, so a YouTube strategy that is essential for one is a rounding error for the other.
- ➜ Even inside a single industry, the earned-media share gap between a 75th and 25th percentile company can reach 43 percentage points (Profound). Your category sets the baseline, not your ceiling.
For anyone deciding where off-page budget goes, this is the framework: find your industry’s citation mix, find your gap against it, then invest in the bucket where you trail. For most brands, that means earned coverage, which is the discipline digital PR link building was built for.
AI Citation Statistics by Platform
Each answer engine has its own citation personality. Optimizing for ChatGPT and optimizing for Gemini are genuinely different jobs, partly because of data licensing: models cannot cite what they cannot see.
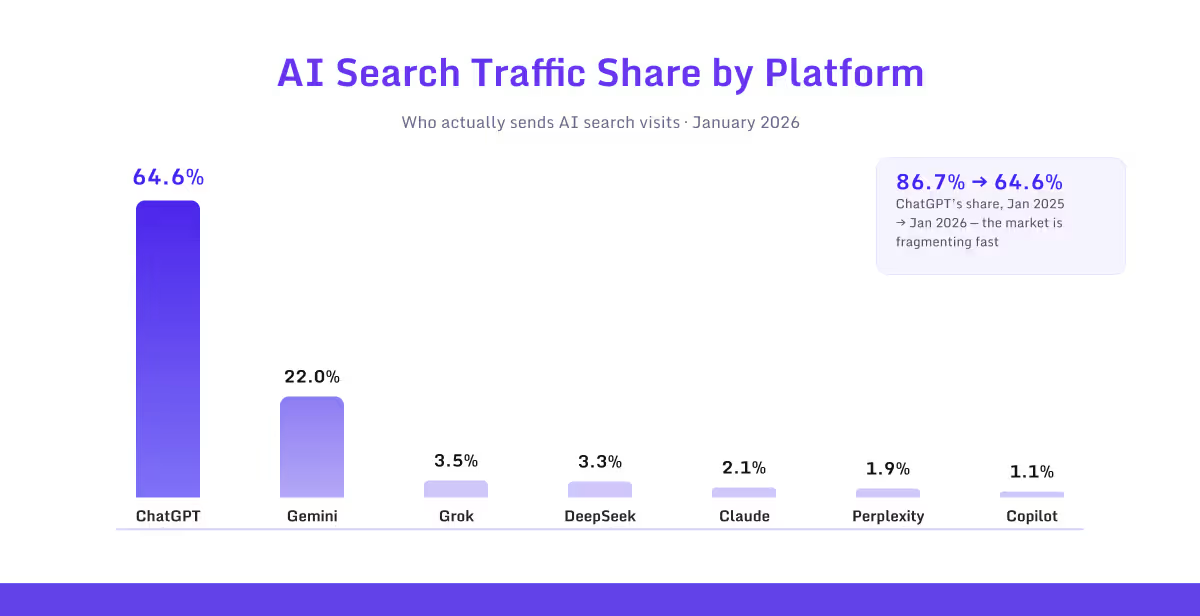
- ➜ AI search traffic share as of January 2026: ChatGPT 64.6%, Gemini 22.0%, Grok 3.5%, DeepSeek 3.3%, Claude 2.1%, Perplexity 1.9%, Copilot 1.1% (Similarweb).
- ➜ ChatGPT’s share was 86.7% a year earlier, so the market is fragmenting fast even as it grows (Similarweb trend data).
- ➜ ChatGPT cites sources in 96% of responses. Gemini cites in 82%. Claude is the most selective, citing in just 55% (Muck Rack, May 2026).
- ➜ ChatGPT averages 15 sources per response and leans on community platforms. Gemini averages just 3, drawn from a smaller pool including Wikipedia and YouTube (Semrush AI Visibility Index, 2026).
- ➜ Google’s models love social: AI Overviews (15.3%) and AI Mode (14.4%) cite social sources at roughly 4x Copilot’s rate, where only 1 in 29 citations is social (Profound).
- ➜ ChatGPT reached 900 million weekly active users in February 2026, up from 400 million a year earlier (OpenAI, via TechCrunch).
- ➜ Only 7.2% of domains appear in both Google AI Overviews and LLM results. The two surfaces cite largely different webs (Search Engine Land, 2025).
- ➜ ChatGPT, Google AI Overviews, and AI Mode disagree on brand recommendations 61.9% of the time for identical queries (BrightEdge Generative Parser, March 2026).
- ➜ Over 30% of all ChatGPT referral traffic flows to just 10 domains, and over 20% of it goes to Google itself (Semrush, April 2026).
Ranking vs Citation: The Relationship That Broke
The most consequential structural change in this dataset is the collapse of the link between ranking well and getting cited. In late 2024, they were nearly the same job. They are not anymore.
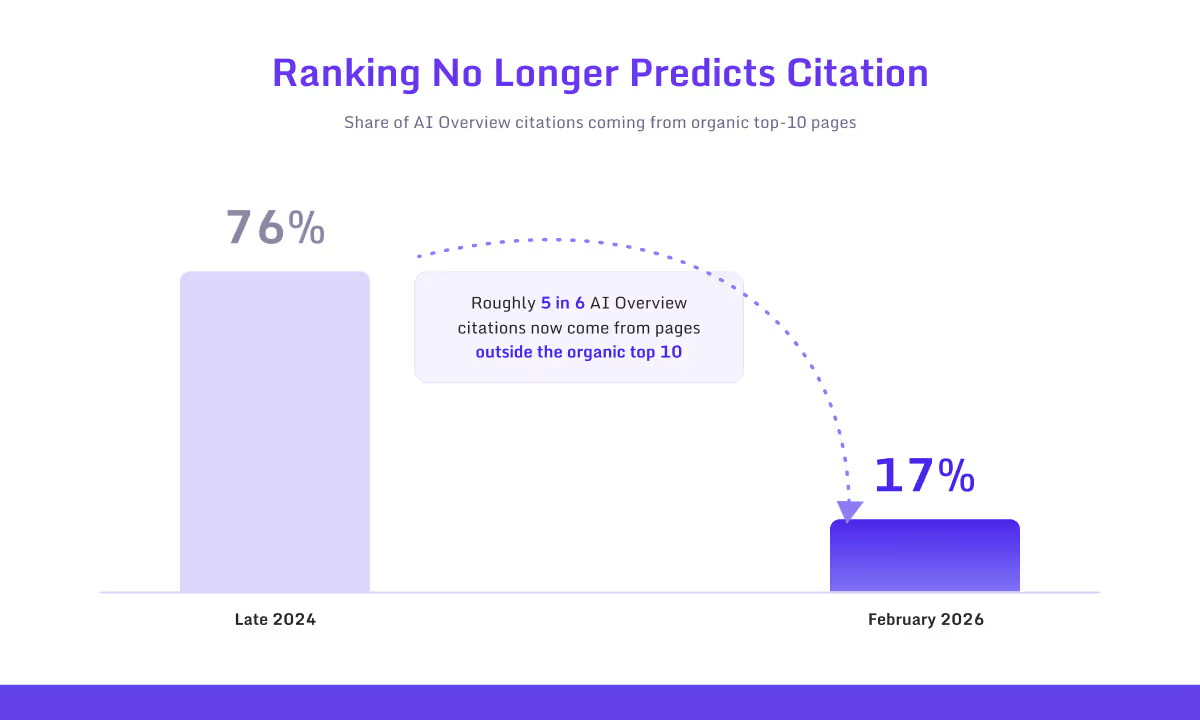
- ➜ Roughly 76% of AI Overview citations came from organic top-10 pages in late 2024. By February 2026, BrightEdge measured that overlap at 17%.
- ➜ Put differently, about 5 in 6 AIO citations now come from pages that do not rank in the top 10 for the query.
- ➜ A parallel cross-methodology analysis (ALM Corp, March 2026) put the 2026 overlap at 38%. The two figures use different datasets, but both confirm a steep fall from 76%.
- ➜ When ChatGPT cites webpages, those pages rank at position 21 or worse in traditional search almost 90% of the time (Semrush).
- ➜ 28.3% of ChatGPT’s top 1,000 most-cited pages have zero organic keywords and no traditional search visibility at all (Ahrefs, September 2025 dataset).
- ➜ The picture is not lawless, though. 97% of AI Overviews still cite at least one source from the top 20 organic results (seoClarity).
- ➜ seoClarity’s breakdown of 5.1 million citations across 362,000 AIOs: 32% came from positions 1 to 3, 41% from positions 4 to 10, and 27% from positions 11 to 20.
- ➜ Ranking number one organically gives you only a 17% to 54% chance of appearing in the AI Overview for that same query, depending on the vertical (composite of BrightEdge and SEOclarity data).
The strategy implication is uncomfortable but clear. Traditional rankings get you into consideration for citations, especially in YMYL verticals. But they no longer guarantee anything, and a growing citation share flows to pages classic SEO would call invisible.
Off-Page Signals and AI Visibility: What the Correlation Data Shows
This is the dataset that should redirect off-page budgets in 2026, and it comes with a finding most link sellers would rather you not read closely. We work in links, and we are showing it to you anyway, because the full picture is better for your strategy than the flattering half.
Ahrefs studied 75,000 brands with Domain Rating above 40, measured which factors correlate with brand mentions in AI Overviews using Spearman correlations, and found that off-site brand signals dominate the top of the list:
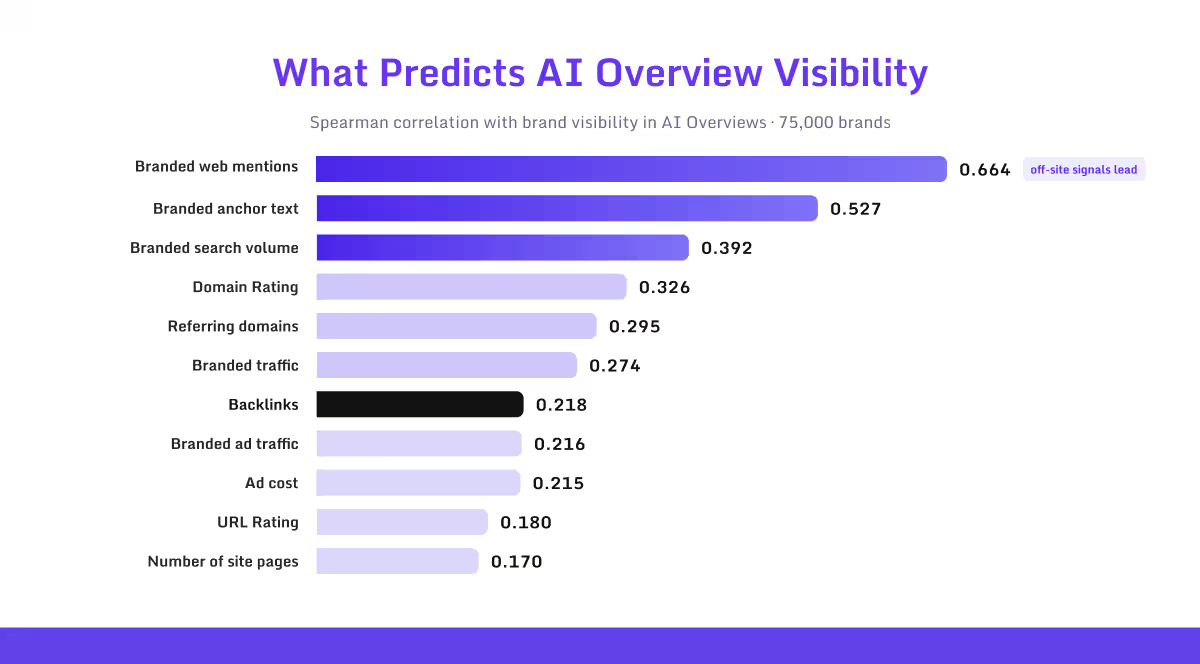
- ➜ Branded web mentions show the strongest correlation with AI Overview visibility at 0.664 (Ahrefs, 75,000 brands).
- ➜ Branded anchor text follows at 0.527, and branded search volume at 0.392. The top three factors are all off-site.
- ➜ Domain Rating correlates at 0.326, referring domains at 0.295, and raw backlink count at 0.218, roughly one-third the strength of mentions.
- ➜ Paid signals barely register: branded ad traffic at 0.216 and ad cost at 0.215. You cannot buy your way into AI answers with media spend.
- ➜ Site size is nearly irrelevant: number of pages correlates at just 0.17. Publishing volume does not build AI visibility.
- ➜ Ahrefs’ December 2025 follow-up extended the study across ChatGPT and AI Mode and found that YouTube mentions the strongest single predictor at roughly 0.737.
- ➜ Seer Interactive’s independent study of ChatGPT brand mentions found the same pattern: domain rating correlated at 0.25 and backlinks at just 0.10, while Google keyword visibility correlated at 0.65.
The visibility cliff
The correlation coefficients understate how uneven the outcomes are. When Ahrefs split brands into quartiles by web-mention volume, the distribution turned into a cliff:
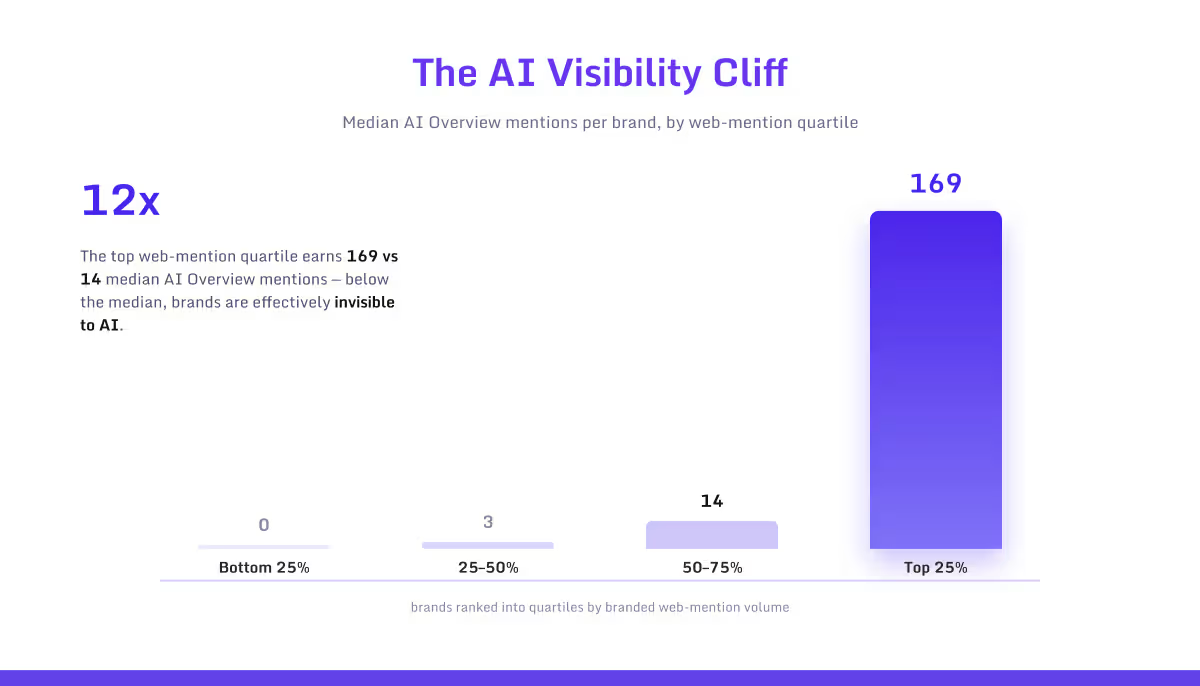
- ➜ Brands in the top 25% for web mentions average 169 AI Overview mentions. The next quartile down averages 14. That is a 12x gap (Ahrefs).
- ➜ Brands in the bottom two quartiles average between 0 and 3 mentions. If you sit in the lower 50% of web mentions, you are essentially invisible to AI systems.
- ➜ 26% of the 75,000 brands studied had zero AI Overview mentions at all.
- ➜ Sites with 32,000+ referring domains are 3.5x more likely to be cited by ChatGPT than sites with 200 or fewer (SE Ranking, November 2025).
- ➜ Domains with profiles on G2, Capterra, or Trustpilot are roughly 3x more likely to earn citations than those without (SE Ranking).
- ➜ Distributing content across a wide range of publications increased AI citations by up to 325% versus publishing on owned sites alone (Stacker, 2025). Flag: this one is self-published by a content distribution agency, so weight it accordingly.
Now the caveat, stated as plainly as Ahrefs states it: correlation is not causation, and every factor in the study lands in the moderate-to-weak range on the Spearman scale. Nobody has proven that earning mentions causes citations. What the data shows is that brands with broad web presence get cited, and brands without it do not.
My read after a year inside this data: mentions and links are not competing tactics. They are correlated outputs of the same underlying asset, brand authority, and branded anchor text at 0.527, which is exactly where the two overlap. Links still carry the classical ranking value. We covered that in why backlinks are important. What changed is that the surrounding mentions, the words on the page, now do independent work for AI visibility.
It also raises the bar on placement quality. A link on a page nobody references teaches an LLM nothing. Vetting for real authority is the whole game now, and our guide on how to check backlink quality covers the signals that matter before you pay for anything.
AI Referral Traffic and Conversion Statistics
The doom narrative dominates AI SEO coverage, but there is a second story in the traffic data: visitors arriving from AI citations are few, growing fast, and unusually valuable. All three things are true at once.
Volume: still small, compounding quickly
- ➜ AI referral traffic averages just 1.08% of total sessions across 13,770 domains and 3.3 billion sessions (Conductor, November 2025).
- ➜ 87.4% of that AI referral traffic comes from ChatGPT specifically (Conductor).
- ➜ AI-driven sessions grew 527% year over year, from 17,076 to 107,100 sessions across 19 GA4 properties, comparing early 2024 to early 2025 (Previsible, via Search Engine Land).
- ➜ A larger 166-site study covering 19 months found monthly AI-referred sessions grew 9.9x, reaching 644,478 by May 2026, with ChatGPT driving over 92% (Adapt, 2026).
- ➜ AI traffic to US retail sites surged 1,324% between October 2024 and May 2026. In travel, the jump is 2,215% (Adobe, 2026).
- ➜ Google still sends up to 345x more traffic than all major AI platforms combined, which keeps the absolute numbers in perspective (Search Logistics compilation of Similarweb data).
- ➜ Semrush projects AI search may start driving more visitors than traditional search for digital marketing topics by early 2028.
Quality: the conversion spread, honestly presented
- ➜ The average AI search visitor is 4.4x as valuable as a traditional organic visitor by conversion rate (Semrush study of 500+ topics, June 2025).
- ➜ Ahrefs measured its own site and found AI visitors converting at 23x the organic rate: 0.5% of traffic produced 12.1% of signups.
- ➜ A separate analysis of 54 websites found no statistically significant conversion difference between AI and organic traffic (Semrush, 2025).
- ➜ In retail, AI-referred visitors spend 48% more time on site and view 13% more pages per visit than non-AI sources (Adobe/eMarketer, March 2026).
- ➜ Behavioral averages across 81,947 sites: AI visitors see fewer pages (4 vs 5.2) and bounce slightly more (67.8% vs 63.7%), but stay longer per visit (86 vs 78 seconds) (Ahrefs traffic quality study).
Why does the conversion multiple range from zero to 23x? Sample composition. The 23x figure is one vendor’s own site, where AI answers pre-qualify an already technical audience. The 4.4x covers marketing topics specifically. The null result covers a small mixed panel. Quote the range, not the cherry-picked ceiling.
What SEO Professionals Actually Believe in 2026
The survey data is where adoption and reality split apart. Practitioners have overwhelmingly adopted AI tools, overwhelmingly believe AI search matters, and overwhelmingly are not measuring it.
- ➜ Roughly 9 in 10 SEO professionals (86%) now have AI integrated into their workflow, up from 65% in 2024, the steepest single-year tooling shift in the survey’s six-year history (Aira State of SEO, n=2,500).
- ➜ 91% of marketers actively use AI in their work in 2026, up from 63% a year prior (Jasper, 2026).
- ➜ About 2 in 3 marketers (65%) name adapting to AI-driven search as their single biggest SEO challenge (GoodFirms survey of 100+ practitioners across 20+ countries, early 2026).
- ➜ Nearly 9 in 10 (86.5%) say ranking number one on Google still matters, but almost all qualify it: mainly for commercial-intent queries (GoodFirms).
- ➜ 10 out of 10. Literally 100% of respondents agreed E-E-A-T will matter more in 2026, the only unanimous finding in the survey (GoodFirms).
- ➜ Yet only 14% track AI or LLM citation visibility, and just 11% monitor branded search volume or share of voice (GoodFirms).
- ➜ 45% of marketing leaders cannot accurately measure their brand’s visibility in AI answers. Only 9% have tools covering all relevant metrics (Semrush AI Visibility Index, 126M prompts plus companion survey, June 2026).
- ➜ Teams that integrate SEO and AI visibility into one workflow report AI-driven traffic or lead gains 81% of the time. Siloed teams: 36% (Semrush, 2026).
- ➜ 49% of marketers say search traffic has already decreased due to AI Overviews and AI Mode (HubSpot State of Marketing).
- ➜ About half of marketers (51.4%) name proving ROI as a top challenge, tied exactly with keeping pace with algorithm changes (GoodFirms).
- ➜ 52% of marketers believe AI makes content so easy to create that it becomes less effective overall (HubSpot, 2026).
- ➜ 67% of digital marketers say tracking GEO performance is more complex than traditional SEO tracking (HubSpot, 2025).
- ➜ On the consumer side, 44% of AI-powered search users call it their primary source of insight, ahead of traditional search at 31% (McKinsey, August 2025).
That 43-versus-14 gap, strategy adoption versus measurement, is the single biggest open opportunity in this dataset. Most of your competitors are optimizing blindly. For the broader off-page benchmarks that pair with these numbers, see our roundup of link building statistics.
What Gets Cited: Content Format and Freshness Signals
Beyond who gets cited, the data on what gets cited is now specific enough to act on. Ahrefs pulled ChatGPT’s 1,000 most-cited pages and profiled them; several independent studies fill in the format layer.
The anatomy of ChatGPT’s most-cited pages
- ➜ Wikipedia alone accounts for 29.7% of ChatGPT’s top 1,000 citations. Homepages and landing pages take 23.8%, educational content 19.4%, and app store pages 6.6% (Ahrefs).
- ➜ Only 32.3% of those top citations are realistically influenceable through outreach: educational pages, reviews, news, and blogs. The other two-thirds are reference surfaces you cannot pitch.
- ➜ Cited pages that rank have a median Domain Rating of 90 and a median of 70 referring domains, but a median URL Rating of just 6. AI cites trusted domains, not heavily linked individual pages.
- ➜ 76.4% of ChatGPT’s most-cited pages were updated within the past 30 days, and 89.7% within the year. Even excluding Wikipedia, 2025-updated pages made up over 80% (Ahrefs).
- ➜ Of cited pages with detectable publish dates, 60.5% were published within the previous two years (Ahrefs). Freshness is a citation signal, not a vanity metric.
Format signals that move citation rates
- ➜ Content containing 5 to 7 statistics earns roughly 20% higher AI citation likelihood (AirOps, April 2026).
- ➜ Comparison pages with three tables earn 25.7% more ChatGPT citations, and shortlist pages averaging 10 or fewer words per sentence earn 18.8% more (AirOps, April 2026).
- ➜ LLMs are 28 to 40% more likely to cite content with clear hierarchical formatting: headings, bullets, numbered lists, and tables (HubSpot, 2025).
- ➜ 44.2% of all LLM citations come from the first 30% of a page’s text. Only 24.7% come from the conclusion (Growth Memo, 2026). Bury your best material and AI never quotes it.
- ➜ Content with ‘best’ in the title captures 7.06% of AI traffic, the top content format, followed by contact pages (6.8%) and how-to guides (6.35%) (Ahrefs GEO research).
- ➜ Around 75% of sites blocking OpenAI or Google AI crawlers, including GPTBot and OAI-SearchBot, still appeared in AI citations anyway (BuzzStream analysis). Blocking mostly forfeits control without buying protection.
One myth-check: an Ahrefs test tracking pages that added JSON-LD schema markup found no statistically significant change in AI citations. Schema aids machine parsing, but it is not a citation cheat code, whatever the GEO sales decks say.
Why Your AI Visibility Number Keeps Moving
Before you celebrate or panic over any AI visibility report, absorb this: AI answers are probabilistic, and the run-to-run variance is enormous. These numbers should change how you read every dashboard in this category.
- ➜ Running 100 identical prompts, ChatGPT surfaced an average of 44 different brands across the responses, with one query set surfacing 95 (SparkToro, January 2026).
- ➜ There is less than a 1-in-100 chance ChatGPT returns the same brand list across 100 identical queries (SparkToro).
- ➜ Only 30% of brands stay visible from one AI answer to the next, and just 20% remain present across five consecutive runs (AirOps 2026 State of AI Search).
- ➜ Only 36 brands rank in the top 100 across all four major AI platforms simultaneously (Semrush AI Visibility Index, 126 million US prompts, January to April 2026).
- ➜ Forums and Q&A platforms show the highest citation volatility across LLMs, ranging 50% to 3,600% depending on the model. YouTube and Wikipedia are the most stable (BrightEdge).
- ➜ Fewer than one in five brands achieves both frequent mentions and consistent citations, a gap Semrush calls the Mention-Source Divide (2025).
Practical rule: never judge AI visibility from a single snapshot. Track trends across repeated runs, and treat any tool showing you a single-day ‘score’ with suspicion.
How to Measure AI Visibility in 2026
This is where every ranking competitor page on this keyword is now out of date. Until mid-2026, measuring AI visibility meant third-party trackers only. That changed in June.
- ➜ On June 3, 2026, Google announced dedicated Generative AI performance reports in Search Console, showing impressions from AI Overviews and AI Mode with URL, country, device, and date breakdowns (Google, via Search Engine Journal).
- ➜ The reports are impressions only. No click data yet, and the rollout began with a subset of sites, UK-first, tied to a competition-regulator requirement.
- ➜ Bing already reports something Google does not: Citation Share, your slice of all citations for a grounding query (Microsoft, 2026).
- ➜ Google has stated explicitly that llms.txt files receive no special treatment in Search, including its generative features. Skip the ritual; invest in original research and clean crawlability instead.
- ➜ 18.9% of ChatGPT messages carry search intent, per OpenAI’s own usage data, which is the denominator behind every ChatGPT visibility metric you see.
First-party data plus a repeated-run third-party tracker is the 2026 measurement stack. We compared the tracker options in detail, including what each one actually measures, in our guide below.
Only 14% of marketers track AI citations. The tooling exists, and most of it takes under an hour to set up. We tested the major platforms and broke down which ones are worth paying for.
→See the Best AI Visibility Tools (Tested)AI Content, Ads, and Revenue Statistics
Three shorter datasets round out the picture: how much of the web is now AI-written, how fast ads are colonizing AI surfaces, and what all this is doing to Google’s revenue. The first set matters most if your team is scaling output with AI agents for content creation, because the ranking data attached to it is blunt.
- ➜ 74.2% of new web pages contain AI-generated content in some form. Only 2.5% are fully AI-generated with no human editing (Ahrefs analysis of 900,000 pages, April 2025).
- ➜ Purely AI-generated content held the number one ranking just 9% of the time; human-classified content held it 80% of the time (Semrush ranking study).
- ➜ Only 7% of marketers publish generative AI output without editing. 56% rewrite it substantially, and 38% make minor edits (HubSpot AI Trends report).
- ➜ The share of content marketing programs using AI hit 97% in 2026, up from 90% in 2025 and 83% in 2024 (Siege Media).
- ➜ Google Ads appearing alongside AI Overviews grew from 5.17% to 25.56% of AIO searches in eight months, a 394% increase (Semrush, October 2025).
- ➜ US AI search ad spend is projected at $2.08 billion for 2026, growing to $25.93 billion by 2029 (eMarketer).
- ➜ Google’s Q4 2025 search revenue hit $63 billion, up 17% year over year (Alphabet earnings). AI features are expanding Google’s ad surface, not shrinking it, which should retire the simplest ‘AI is killing Google’ takes.
- ➜ McKinsey projects $750 billion in US revenue will flow through AI-powered search by 2028, with AI summaries expected on more than 75% of Google searches by then (McKinsey).
Consumer Trust and AI Accuracy Statistics
One more dataset that rarely makes the roundups, and should: users are getting more skeptical of AI answers even as they use them more. That tension shapes how citations convert into actual trust.
- ➜ Consumer trust in AI search dropped from 82% to 54% in a single year, a 28-point decline (Fractl survey, n=1,008 US consumers, 2026).
- ➜ Buyers now validate purchase decisions across an average of 2.4 platforms before acting (Fractl, 2026).
- ➜ For trusted product recommendations, Google leads AI tools roughly 3 to 1: 39% versus 14%, with Reddit at 15% in between (Fractl).
- ➜ Roughly 1 in 10 AI Overviews contains inaccurate or misleading content, and nearly half of AI answers include claims not supported by their own cited sources (Oumi study).
- ➜ Eight generative search tools, including ChatGPT Search and Perplexity Pro, answered more than 60% of news-citation test queries incorrectly (Columbia Journalism Review Tow Center).
- ➜ Hallucination rates climb with output length, peaking at 35% for articles in the 13,500 to 15,000 word range (Vectara hallucination leaderboard).
- ➜ 83% of users still say answer engines are more efficient than traditional search (HubSpot GEO research). Skepticism and adoption are rising together, which is exactly why verifiable, well-sourced pages win citations.
What These AI SEO Statistics Mean for Your Strategy
If you strip this whole dataset down to actions, six survive contact with the evidence:
- Audit your content portfolio by intent. 99.9% of AIO triggers are informational, and ecommerce coverage collapsed to 4%. Commercial-intent pages still earn clicks; generic informational content increasingly earns a summary instead of a visit.
- Build web mentions like you once built links. The 0.664 versus 0.218 correlation gap, the 12x quartile cliff, and the 84% earned-media citation share all point in the same direction. Off-site presence is the strongest lever the data supports.
- Know your industry’s citation mix before spending. Pharma runs on 59% earned media, SaaS on 11.4%. The same off-page budget buys very different AI visibility depending on your category’s baseline.
- Structure pages for extraction. Front-load key material into the first 30% of the page, use 5 to 7 sourced statistics, add comparison tables, and keep sentences short. Each of those has a measured citation lift attached.
- Refresh what you want cited. 76.4% of ChatGPT’s most-cited pages were updated within 30 days. A stale page is a page AI skips.
- Start measuring now, imperfectly. Only 14% of your competitors track AI citations. Turn on Search Console’s generative reports when they reach you, add a repeated-run tracker, and watch branded search volume as your proxy for invisible AI influence. Our off-page SEO checklist covers the authority-building half of that program step by step.
FAQs: AI SEO Statistics in 2026
What percentage of Google searches are zero-click in 2026? +
Do backlinks still matter for AI search visibility? +
How many AI citations come from earned media? +
Does ranking number one get you cited in AI Overviews? +
Which country sees the most AI Overviews? +
Is AI referral traffic worth more than organic traffic? +
How do I track my brand’s AI visibility? +
Which industries face the most AI Overview exposure? +
Methodology and Sources
This article draws on primary research published between 2024 and August 2026. Every statistic was traced to a named study before inclusion; aggregator blogs were used only to locate primary sources. Where studies conflict, both figures appear with an explanation. Sources are tiered by evidence strength:
- ➜ Behavioral and clickstream panels: Pew Research Center (68,879 tracked searches, 900 US adults, March 2025); SparkToro/Datos (multi-million-user clickstream, 2024); Similarweb (2024 to 2026 panels).
- ➜ Large-scale citation datasets: Profound (11.84B citations, 8 models, 29 industries, April to July 2026); Muck Rack Generative Pulse (25M+ links, three editions since July 2025); Ahrefs Brand Radar (108M AIO queries; 75,000-brand correlation study; top-1,000 ChatGPT citations); seoClarity (5.1M citations across 362,000 AIOs); BrightEdge Generative Parser (9 industries, February 2025 to February 2026); Semrush AI Visibility Index (126M US prompts, January to April 2026).
- ➜ CTR and traffic studies: Ahrefs (300,000 keywords, December 2025); Seer Interactive (25.1M organic and 1.1M paid impressions, 42 organizations); Conductor (13,770 domains, 3.3B sessions); Adobe Digital Insights (US retail and travel, 2026); Previsible (19 GA4 properties).
- ➜ Practitioner and consumer surveys: Aira State of SEO (n=2,500); Jasper State of AI Marketing 2026; GoodFirms (100+ practitioners, 20+ countries, self-selected and directional per its own methodology note); HubSpot State of Marketing 2026; McKinsey AI Discovery Survey (n=1,927); Fractl (n=1,008); Bain and Dynata (December 2024).
- ➜ Platform first-party data: Google (I/O 2026, Search Console announcements, AI Mode insights); OpenAI usage data; Alphabet earnings; Microsoft Bing.
Known limitations: Google disputes Pew’s methodology window. Correlation studies (Ahrefs, Seer) do not establish causation. Vendor-measured conversion figures reflect the vendor’s own audience. Survey samples from GoodFirms and Aira are self-selected. We flag each of these inline where the stat appears.
Need the Authority Side Handled, Not Just Measured?
Our media placement service earns the third-party coverage that both citation studies, whichever one you believe, agree is the input AI systems trust.
Explore Publisher Listings