The industry standard for the amount of investment that businesses make in SEO efforts is usually between $1,001 to $2,500 per month for mid-market companies. Large-scale businesses go even further, with averages from $10,000 to $50,000. Local businesses usually enter the market with $1,000 to $3,000 per month, while high-growth SaaS companies currently dedicate 5-10% of their overall marketing budget to organic growth and authority development.
For today’s marketing leaders and growth engineers, these numbers signal a paradigm shift in the “cost of visibility.” We have officially entered the Intelligence Era. The play to win in 2026 is no longer about the sheer amount of content. Rather, it is based on the fusion of entity-based authority and a technical “Fortress Stack” engineered for both humans and machines.
The 2026 landscape demands Generative Engine Optimization (GEO) alongside traditional technical SEO. AI Overviews appear on 58% of informational queries, dropping organic CTR from position 1 to 2.6%.
Unlike paid channels that halt when budgets stop, organic authority compounds. B2B SaaS SEO delivers 702% ROI ($7 per $1 spent), making it a critical capital investment versus volatile paid acquisition.
To amplify your investment strategy, book Linkscope’s free backlink audit and identify your money pages needing an authority boost and secure your rank.
The “SEO Investment” TL;DR (Key Statistics)
- ➜ Global Budget Increases: 57% of businesses plan to increase their SEO budget by 10-20% in 2026 to keep pace with AI search shifts.
- ➜ Average Monthly Spend: The most common monthly retainer for mid-sized businesses globally currently sits between $1,000 and $2,500.
- ➜ The AI Premium: AI-specific SEO services typically range from $3,000 to $15,000 per month due to the complex entity modeling required for Generative Search.
- ➜ Hourly Rates: Experienced SEO consultants average between $75 and $150, scaling up to $300 for senior technical experts.
- ➜ROI Champion: 49% of business owners report that SEO offers the best ROI across all digital channels, with an average ratio of 22:1.
- ➜ Break-Even Horizon: It typically takes six to twelve months to break even and achieve positive ROI after investing in technical SEO foundations.
- ➜Enterprise Adoption: 85% of enterprises prefer monthly retainer models over one-off projects to maintain long-term organic authority.
- ➜ High-Authority Link Acquisition: The investment for acquiring quality backlinks from reputable domains generally ranges from $150 to $2,000 per placement.
- ➜ Link-to-Length Ratio: Content exceeding 3,000 words earns ~68% more backlinks than shorter articles, significantly lowering authority acquisition costs.
- ➜ Organic Lead Conversion: Organic search leads convert at a 2.6% B2B rate vs 1.7% outbound (8x qualified intent advantage).
1. SEO Pricing Breakdown: Service Levels & Deliverables
Modern businesses are moving away from rigid “packages” toward outcome-based service tiers. In 2026, pricing is dictated by the depth of integration with AI search systems and the complexity of the technical environment. Organizations now categorize spend based on the maturity of their digital presence and the intensity of their competitive landscape.
Table 1: SEO Pricing by Service Level
| Business Type | Typical Monthly Investment | Common Services Included |
|---|---|---|
| Small Local Business | $500 or less | Basic on-page SEO, simple reporting |
| Established Small Business | $501 – $1,000+ | Technical fixes, content suggestions |
| Mid-Sized Business | $1,001 – $2,500+ | Content creation, basic link building |
| Competitive Industry | $2,501 – $5,000+ | Advanced technical SEO, active link building |
| Enterprise / Large Business | $5,000++ | Custom strategy, dedicated specialists |
Source: Backlinko
Table 2: Individual Service Costs
| Service Type | 2026 Price Range | Billing Metric |
|---|---|---|
| Technical Audit | $1,000–$5,000 | Per Project |
| Link Building | $150–$2,000 | Per Placement |
| On-Page Optimization | $100–$250/hour | Hourly |
| AI/GEO Projects | $2,000–$5,000 | Per Project |
Source: webfx, outerboxdesign, arc4
To accurately gauge these costs, businesses often rely on comprehensive market data. For a deep dive into vertical-specific benchmarks, explore our latest report on 150+ SaaS Statistics and Trends 2026.
2. Core Pricing Models: How SEO is Billed in 2026
The billing structure chosen often reflects the maturity of the brand’s organic strategy. The Monthly Retainer is utilized by 85% of enterprises, as this model supports compounding growth and long-term authority maintenance. It ensures consistent resources are allocated to technical health and content velocity.
Alternatively, Project-Based or Milestone billing is best suited for high-impact technical shifts, such as site migrations or the initial setup of a “Fortress Stack.” For brands requiring specialized strategic oversight, Hourly Consulting remains available, with rates typically ranging from $75 to $200 per hour. Finally, Performance-Based models are emerging where costs are tied strictly to achieving “Top 3” visibility or specific lead volume targets.
What % of the total marketing budget goes to SEO by company size?
- ➜ Startups/New Businesses: 30-40% (Foundation building)
- ➜ SMBs (1-50 employees): 20-30%
- ➜ Mid-Market (50-500): 15-25%
- ➜ Enterprise (500+): 10-15% (Maintenance/Optimization mode)
Pro Tip: To ensure your investment doesn’t go toward low-quality assets, use these 11 Simple Ways to Check Backlink Quality to avoid Google penalties and protect your domain’s integrity.
3. Key Factors That Affect How Much Businesses Invest in SEO
Investment requirements are not arbitrary; they are driven by the specific friction points within a digital ecosystem. SEO professionals evaluate the “cost of entry” by analyzing five primary variables that dictate the resource intensity of a campaign.
A. Website Size and Complexity (Impact: 5/5)
The technical footprint of your site is the strongest predictor of cost. A small, 10-page local service site requires significantly less maintenance than a database-driven e-commerce platform with thousands of SKUs. Large-scale sites demand higher pricing tiers due to the complexity of managing crawl budgets and site architecture.
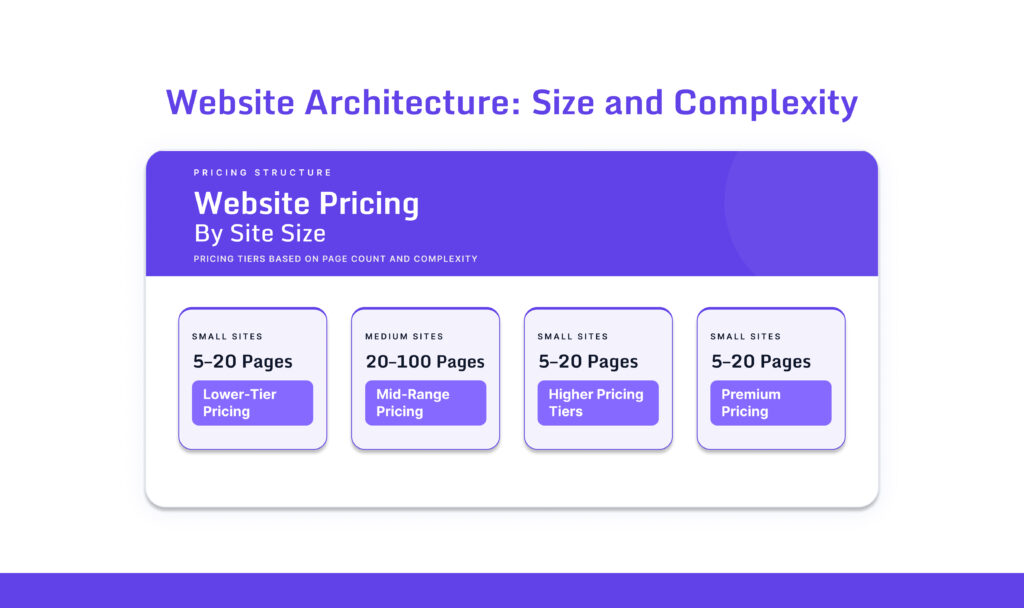
- ➜ Small (5–20 pages): Lower-tier pricing.
- ➜ Medium (20–100 pages): Mid-range pricing.
- ➜ Large (100+ pages): Higher pricing tiers.
- ➜ E-commerce/Database sites: Premium pricing due to programmatic complexity.
B. Industry Competitiveness (Impact: 4.5/5)
Market density acts as a “starting line” for your budget. If you operate in high-volatility niches like Finance, Legal, or Healthcare, expect steeper costs. These industries require exceptional content quality and sophisticated link-building to overcome high keyword difficulty scores and competitors with massive, established budgets. YMYL niches demand 2-3x higher spend due to E-E-A-T requirements and entrenched competitors. Here’s exactly what each vertical pays:
| Industry | Monthly SEO Spend | % of Mktg Budget | Avg KD | Key Investment Driver |
|---|---|---|---|---|
| Legal | $5,000–$10,000 | 20-30% | 80-95 | Citation velocity (10+ DA70+/mo), expert authors |
| Healthcare | $3,000–$8,000 | 15-25% | 70-90 | Medical schema, patient journey clusters, HIPAA compliance |
| DTC / eCommerce | $2,500–$15,000+ | 15-30% | 60-85 | Category page optimization, faceted navigation, internal linking |
| Marketplaces | $5,000–$15,000+ | 20-30% | 75-90 | Programmatic schema, seller page authority, rich snippet saturation |
| Real Estate | $2,000–$6,000 | 12-20% | 50-75 | 1,389% ROI leader, hyper-local landing pages, IDX integration |
| Cybersecurity | $2,500–$7,500 | 15-25% | 65-85 | B2B thought leadership, Gartner quadrant targeting, case study clusters |
| EdTech | $2,500–$7,500 | 12-25% | 55-80 | Course funnel optimization, LMS integrations, and comparison table SEO |
| Manufacturing | $2,000–$5,000 | 10-15% | 45-70 | Long-tail spec targeting (6,400% volume opportunity), spec sheet clusters |
Source: Pinnacle Pursuit SEO, upgrowth
Why These Ranges?
Legal/Healthcare requires ongoing expert content ($0.50+/word) and 10x link velocity. eCommerce scales with catalog size (500+ pages = $10k+). Real Estate wins with hyper-local authority (1,389% ROI). Manufacturing leverages long-tail specs ignored by competitors.
C. Provider Experience & Geographic Labor Costs (Impact: 4.25/5)
The track record of your SEO partner and their physical location remain significant variables in the final quote. Professionals with a decade of experience have built the systems and networks necessary to deliver results faster, though they command a higher premium.
| Provider Experience Level | Typical Monthly Pricing | Geographic Tier | Pricing Level |
|---|---|---|---|
| Entry-Level (1–3 yrs) | Under $1,000/mo | US, UK, Australia | Highest |
| Mid-Career (4–6 yrs) | $1,001 – $2,500/mo | Western Europe | Upper-Mid |
| Veteran (7–10+ yrs) | $2,501 – $5,000+/mo | South Asia / LatAm | Lower |
D. Service Scope and Comprehensiveness (Impact: 3.8/5)
The breadth of the “SEO Stack” you deploy directly scales the investment. Basic on-page optimization is the most affordable entry point, while comprehensive strategies that include international SEO or complex technical oversight sit at the top of the pricing spectrum. According to Loopex Digital, monthly SEO retainers vary based on the level of service:
- ➜ Basic (10–15 hours/month): $1,160 to $1,800 – Keyword research and on-page fixes only.
- ➜ Standard / Mid-Tier (20–25 hours/month): $2,312 to $2,890 – Includes technical SEO and consistent content creation.
- ➜ Comprehensive / High-Tier (30–40 hours/month): $3,500 to $4,600+ – Full-funnel strategy including link building and digital PR.
- ➜ Specialized: Premium rates for International or Enterprise E-commerce needs.
E. Technical Status and Acceleration (Impact: 4/5)
Beyond the primary factors, specific technical hurdles can inflate initial costs. Websites with legacy technical debt, such as existing manual penalties or poorly managed JavaScript frameworks, require specialized expertise to repair. Furthermore, if a business demands an accelerated timeline to hit growth targets, costs typically increase to account for higher link velocity and content production.
A balanced SEO budget is divided into three pillars:
- The Foundation (40%): Technical SEO, Core Web Vitals (specifically INP), and Site Architecture.
- The Growth Pillar (40%): High-intent content clusters, Digital PR, and Authority Backlinks ($150–$2,000 per placement).
- The Intelligence Pillar (20%): Generative Search (GEO), LLM visibility, and RAG (Retrieval-Augmented Generation) integration to ensure the brand appears in AI Overviews.
4. Benchmark Data: How Much Do Businesses Invest in SEO by Region?
Global investment in organic search is dictated by market maturity, local labor costs, and competitive density. While businesses worldwide pursue the same visibility, the “cost of entry” varies significantly between established Western hubs and emerging digital markets.
Global SEO Pricing Comparison (USD)
The following table benchmarks monthly retainers, hourly consulting fees, and project-based rates across primary global regions for 2026.
| Region | Typical Monthly Range | Hourly Rates | Project-Based |
|---|---|---|---|
| North America | $2,500 – $15,000+ | $100 – $250 | $1,000 – $5,000 |
| Europe | $668 – $3,500+ | $25 – $125 | $1,000 – $5,000 |
| Oceania (AU/NZ) | $916 – $6,500+ | $14 – $173 | $577 – $650+ |
| Asia (Philippines) | $260 – $8,600+ | $52 – $172 | $860 – $3,500 |
| Middle East / UAE | $408 – $4,000+ | $100 – $200 | $1,000 – $3,000 |
| South America | $260 – $2,000+ | $30 – $100 | $260 – $875 |
| Africa | $70 – $700+ | $30 – $100 | $143+ |
Source: Truelogic
Regional Market Drivers
- ➜ North America: Remains the most expensive market due to fierce competition and high operational costs. Enterprise-level firms here often exceed $15,000 in monthly spend to maintain technical dominance.
- ➜ Europe: Focuses heavily on localized, multi-language strategies and GDPR compliance. Markets like Germany (DE) and France (FR) see higher mid-market retainers, averaging up to $3,500 monthly.
- ➜ Asia-Pacific (APAC): A polarized market. While the Philippines offers affordable, flexible scaling, high-velocity hubs like Singapore and Australia demand robust budgets ($6,000+) focused on ROI and sectoral performance.
- ➜ Middle East & Emerging Markets: Rapid digital adoption in Africa and Central Asia is driving scalable, multilingual SEO needs. In the UAE, specialized voice and multilingual search strategies command a premium of $3,000 to $4,000.
Regardless of your geographic location, Linkscope’s 2026 data shows that 3,000+ word pages earn 68% more backlinks. This makes deep, high-quality content a globally effective cost-saving measure for building domain authority. To maximize your international or local growth, follow our 30-Step Off-Page SEO Checklist That Actually Works to dominate the SERPs.
5. SaaS & Enterprise: Budgeting by ARR and Industry
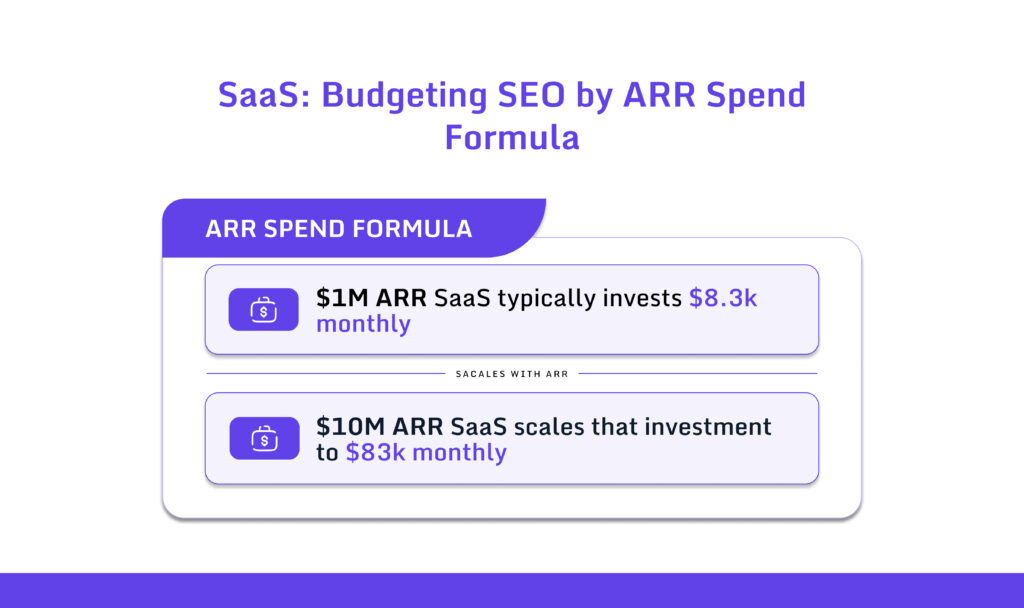
High-growth SaaS firms treat SEO as a percentage of revenue rather than an arbitrary expense. Many firms adopt the ARR Spend Formula, where a $1M ARR SaaS typically invests $8.3k monthly, while a $10M ARR SaaS scales that investment to $83k monthly. This ensures the organic engine grows in lockstep with company revenue, preventing the “plateau effect” often seen in underfunded campaigns.
B2B vs B2C allocation benchmarks
The strategic intent changes based on the business model:
- ➜ B2B Allocation: Averages 7.7% of revenue to marketing, with SEO receiving 20-30% of that budget. Channel priority sits at SEO > LinkedIn > PPC.
- ➜ B2C / DTC Allocation: Averages 9-12% of revenue due to higher consumer acquisition costs, with SEO receiving 15-30%. Channel priority sits at PPC > Social > SEO.
Industry nuances also dictate spend. FinTech requires a high investment due to extreme E-E-A-T requirements and the need for complex technical security layers. Conversely, E-commerce spend is heavily weighted toward category page authority and technical crawl budget optimization to handle thousands of product SKUs efficiently.
If you are scaling a store, consulting the Top 65+ Shopify SEO Experts in 2026 can help you allocate your budget toward high-impact retail specialists who understand the 2026 algorithm shifts.
6. Why is SEO Expensive? (And Why Cheap SEO Fails)
Modern SEO is a cross-disciplinary field requiring a diverse expertise premium. It necessitates data science for intent mapping, PR for authority building, and engineering for technical “Fortress Stack” maintenance.
Furthermore, the infrastructure costs are substantial; a professional “Modern SEO Stack” exceeds $2,500 monthly in software licenses alone (covering Ahrefs, SEMrush, Screaming Frog, and AI-driven GEO trackers).
SEO vs Other Channels Comparison
| Metric | SEO/Organic | PPC/Paid |
|---|---|---|
| Position 1 CTR | 39.8% | 2.1% |
| Lead Conversion | 14.6% | ~10% |
| 3-Year ROI | 748% | ~200% |
| Budget Split (Growth Phase) | 40-50% | 50-60% |
Source: whitehat-seo.co
Investing in $500 monthly “cheap” SEO packages is a high-risk strategy that often results in algorithm penalties. These automated services frequently utilize spammy link networks that trigger manual actions. Fixing a “Shadow Ban” or a manual penalty typically costs 10x more than the initial saving, effectively erasing any perceived budget gains.
True SEO investment focuses on “Information Density”, delivering expert-led insights that AI search engines find worth citing.
7. The 2026 Allocation Map: Where Does the Investment Go?
A balanced SEO budget is generally divided into three major pillars. The Foundation receives 40–50% of the spend, covering Technical SEO, crawlability, and Core Web Vitals, specifically INP (Interaction to Next Paint) optimization. This ensures the site remains healthy enough to support new growth.
- The Foundation (40–50%): Technical SEO, crawlability, and Core Web Vitals (INP optimization).
- The Growth Pillar (30–40%): High-intent content clusters and link equity.
- AI and GEO Visibility (10–20%): Large Language Model Optimization and RAG integration to appear in AI Overviews.
The Growth pillar accounts for 30–40% of the budget, focusing on high-intent content clusters and link equity acquisition. Finally, AI and GEO Visibility now command 10–20% of the investment. This newer allocation covers Large Language Model Optimization and RAG (Retrieval-Augmented Generation) integration to ensure the brand appears in AI-generated search summaries and “AI Overviews.”
Join 147+ agencies using Linkscope’s Ultimate Link Building Checklist to prioritize high-value pages and ensure your growth pillar delivers maximum impact.
8. SEO Investment Timeframe & Expected ROI
SEO is a long-term capital asset that requires a phased approach to yield a return. Unlike the instant “on-off switch” of paid advertising, organic search follows a compounding trajectory where initial groundwork facilitates future exponential growth.
The Organic Growth Lifecycle
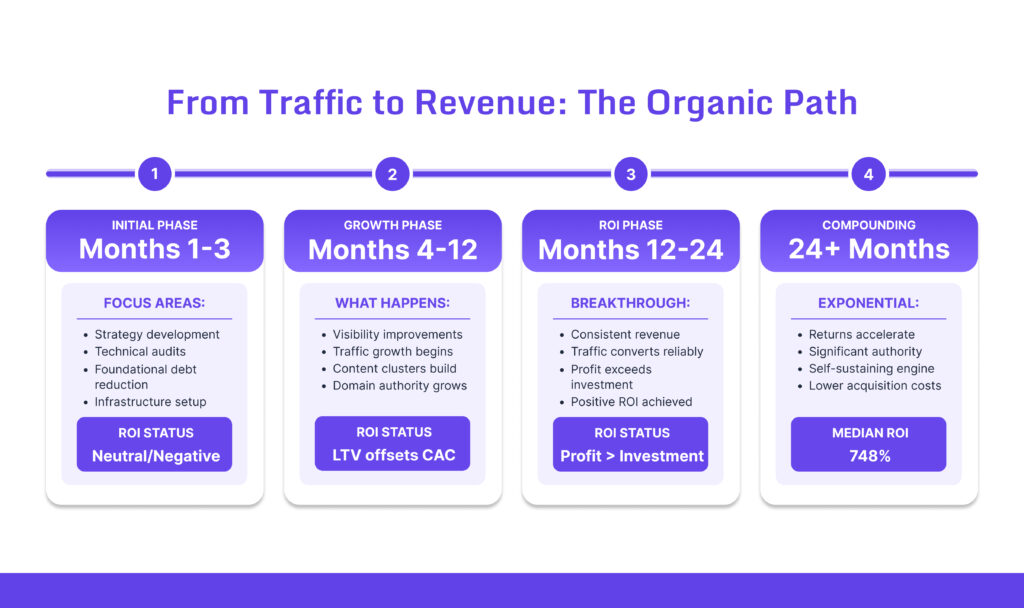
The typical maturity timeline for an SEO investment follows four distinct stages:
- ➜ Initial Phase (Months 1-3): Focus is on strategy development, technical audits, and foundational “debt” reduction. At this stage, ROI is usually neutral or negative as resources are heavily weighted toward infrastructure.
- ➜ Growth Phase (Months 4-12): Gradual improvements in visibility and traffic appear as content clusters and domain authority build. Customer lifetime value (LTV) begins to offset the cost of acquisition (CAC).
- ➜ ROI Phase (Months 12-24): Organic traffic converts to consistent revenue. This is the stage where total profit typically exceeds the cumulative investment.
- ➜ Compounding Phase (24+ Months): Returns accelerate as the site gains significant authority. At this point, organic leads achieve a 748% median ROI, creating a cost-effective lead generation engine that persists even if monthly spend is optimized.
% of Revenue Allocated to Marketing Overall
Take a look at what ratio industry leaders are allocating to achieve expected revenue:
| Industry | % of Revenue |
|---|---|
| Professional Services | 11.06% |
| Real Estate | 9.82% |
| Healthcare | 9.31% |
| Tech/EdTech | 9.16% |
| Manufacturing | 6.67% |
| B2B Average | 7.7% |
| SaaS/Cybersecurity | 7-15% |
Source: hubspot, yadavbikash
Variables in the ROI Equation
No two websites share an identical timeline. A skilled consultant identifies specific “accelerators” and “delays” based on your competitive context.
| ROI Accelerators | ROI Delays (Friction Points) |
|---|---|
| Low-Competition Niches: Faster rankings with less capital. | Highly Competitive Markets: Require high investment over time. |
| High-Value Conversions: Low traffic volume still drives high revenue. | Technical Debt: Significant legacy issues must be fixed before growth. |
| Existing Content: Optimizing old assets yields faster “quick wins.” | Low Conversion Values: Requires massive traffic to break even. |
| Quick Implementation: Rapid execution of tech fixes speeds up results. | Implementation Delays: Slow internal dev teams extend the timeline. |
Calculating Your Potential Return
While precise prediction is complex, you can estimate your Monthly SEO Value using this standard formula:
Monthly Organic Traffic x Conversion Rate x Average Order Value (AOV) = Monthly Revenue Value
Example Case Study: If your campaign reaches 5,000 monthly visitors with a 2% conversion rate and a $100 AOV, your monthly organic value is $10,000. If your SEO investment is $2,000 monthly, you are achieving a 5x monthly return (500% ROI) once that traffic level is sustained.
9. Emerging Markets SEO Benchmarks
Market dynamics in emerging economies create unique cost advantages for startups and global brands seeking localized dominance. While North America and Western Europe command premium pricing, emerging markets offer 50-80% lower entry costs due to localized talent pools and reduced competition in native-language SERPs. However, growth drivers vary dramatically by region.
Emerging Markets SEO Pricing Comparison (SMB Monthly Retainers)
| Market | Monthly SMB Range | Hourly Rates | Growth Drivers | Key Challenges |
|---|---|---|---|---|
| India | $800–$3,000 | $10–$30 | Mobile-first indexing, Hindi/Regional SERPs, UPI commerce boom | Multilingual content, hyper-local competition |
| Brazil | $1,200–$4,000 | $15–$40 | Portuguese e-commerce surge, Pix payments, Mercado Libre dominance | High mobile bounce rates, Portuguese schema |
| SEA (Indonesia, Vietnam, Thailand) | $1,000–$5,000 | $12–$35 | TikTok Shop explosion, Shopee/Lazada dominance, Local language AI | Cross-platform optimization, voice search surge |
| Mexico | $900–$3,500 | $12–$38 | Nearshoring boom, Mercado Libre, Spanish SERP localization | Cart abandonment (70% avg), mobile commerce |
| Nigeria | $500–$2,500 | $8–$25 | Jumia dominance, mobile money (MTN MoMo), Pidgin English SERPs | Payment gateway fragmentation, 4G penetration |
Regional Cost Advantages
- ➜ India: 60-75% cheaper than US/UK equivalents; 500K+ English/Hindi SEO specialists [Truelogic data context]
- ➜ Brazil: Premium within emerging markets due to Mercado Libre ecosystem lock-in
- ➜SEA: Highest variance; Singapore = $6K+, Indonesia = $1K due to TikTok Shop revenue sharing
- ➜ Africa: Lowest barrier ($500 entry) but highest implementation friction
Strategic Playbook for Emerging Markets
- Hyper-Local Language: Hindi (India), Bahasa (Indonesia), Portuguese (Brazil) SERPs have 3x lower KD than English
- Mobile-First Commerce: 85%+ mobile traffic requires AMP + PWA optimization
- Platform Dominance: TikTok Shop (SEA), Mercado Libre (LATAM), Jumia (Africa) drive 70% e-comm traffic
- Payment Localization: UPI (India), Pix (Brazil), MoMo (Africa) integration boosts CTR 25%
Linkscope’s global publisher network spans 80+ countries with native-language DA40+ domains, enabling cost-effective authority building across emerging markets.
10. SEO Budget Seasonality
Budgeting for SEO often follows annual corporate cycles. In Q1, there is typically a 25% increase in spend as new annual budgets are deployed and firms initiate competitive land grabs. During Q4, spend can jump by 40%, driven by holiday e-commerce demands and year-end fiscal planning to secure future organic positioning. Strategic investors often use Q3 to “pre-fund” Q4 authority, ensuring that by the time search volume peaks, their domain is already dominant.
Final Thoughts: Strategic Investing for 2026 Dominance
To win in the digitally competitive landscape of 2026, a business must view SEO as a compounding revenue asset. Companies relying strictly on paid acquisition are being outscaled by competitors who invest in long-term organic authority and AI-search readiness.
Effective investment requires at least $1,500 – $3,000 monthly for mid-market growth. Scaling higher requires a commitment to technical depth and “Information Density.” By viewing SEO as a capital expenditure, brands can build a sustainable “Fortress Stack” that resists market volatility and remains visible across both traditional and AI-driven search engines.
Ready to dominate the SERPs with a 7-14 day delivery guarantee? Book a 15-minute call with our agency team for volume discounts and a custom growth roadmap tailored to your 2026 goals.
Frequently Asked Questions (FAQ)
How much should I spend monthly?
Benchmarks range from $1,500 to $100k, depending on your current revenue and industry niche. Most mid-market firms find the most success spending between $5,000 and $15,000 to maintain a competitive edge.
Is $1,000 per month enough for SEO?
Generally, no, as this budget barely covers the cost of high-quality content and basic tools. In competitive niches, you require a minimum of $2,000 for meaningful movement and authority building.
What is the ideal SEO vs. Ads budget split?
A 60/40 split favoring organic search is the 2026 efficiency benchmark for most established brands. This balance allows for immediate traffic via ads while building a long-term, low-cost organic foundation.
What is the expected ROI timeline for B2B SaaS?
B2B SaaS typically sees a positive ROI at the 7-month mark due to the longer sales cycle. However, the compounding nature of SEO means that year two and beyond often see significantly higher profit margins.
What is the cost per word for technical content?
Expect to pay $0.20 to $0.50 per word for expert-led content with high technical depth. Cheaper content often lacks the “Information Density” required to rank in the AI-driven search era.
How much do high-quality backlinks cost?
High-authority placements typically range from $150 to $2,000 per domain, depending on the site’s traffic and relevance. Investing in cheaper, low-quality links can result in search engine penalties.
Should I hire an in-house SEO or an agency?
Agencies generally offer faster scaling and broader access to expert teams and tool stacks. In-house hires offer deep product focus but often require a larger initial investment in salary and infrastructure.