For engineering leaders and growth marketers, the SaaS statistics and trends movement represents a paradox: while the global SaaS market is expanding towards a $1,228.87 billion valuation by 2032, the “cost of noise” has never been higher. With the average enterprise now juggling 130 to 410 individual SaaS apps, the winning strategy isn’t just “more software”, it’s integrated, AI-native efficiency.
The ‘Software as a Service’ movement has officially given way to the ‘Intelligence Era.’ As we continue through the tech evolution, the SaaS movement is no longer just about moving spreadsheets to the cloud; it’s now about autonomous agentic workflows, vertical-specific deep tech, and a fundamental shift in value pricing and consumption.
Let’s explore the latest SaaS statistics and trends of 2026 below.
Key SaaS Stats
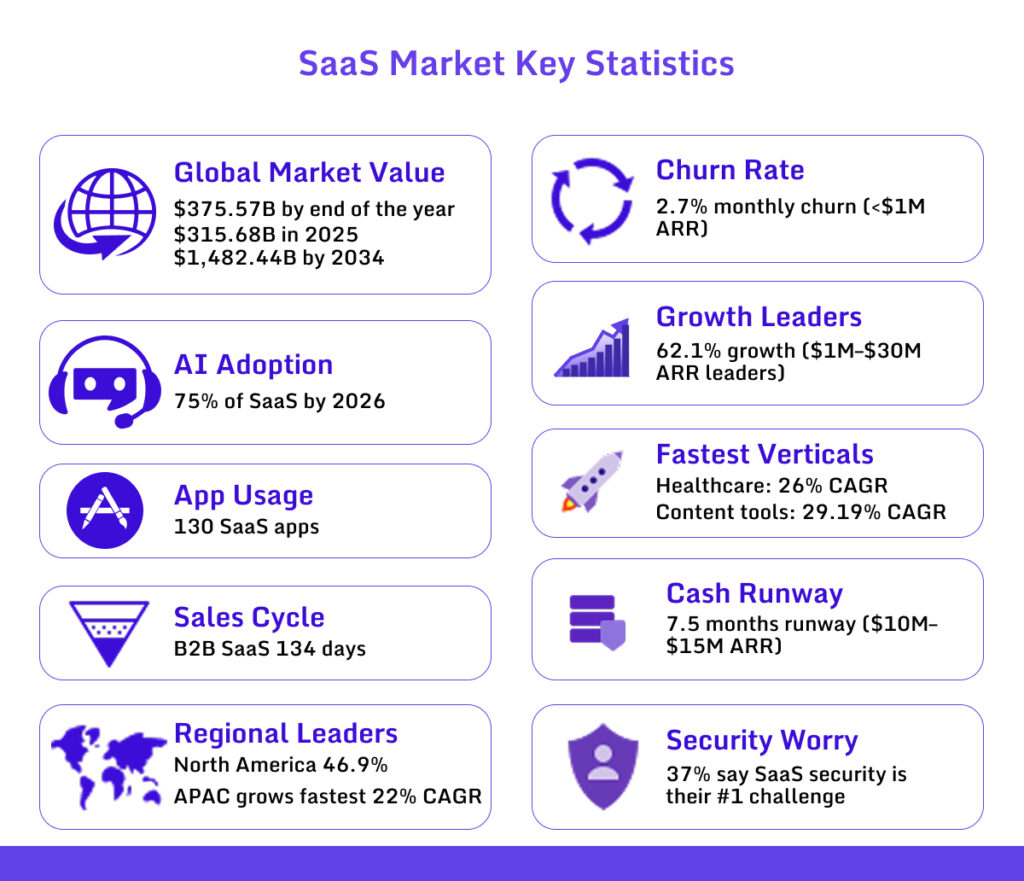
- ➜ Global Market Value: Projected at $375.57B by the end of the year, up from $315.68B in 2025, reaching $1,482.44B by 2034. (Fortune)
- ➜ AI Adoption: 75% of SaaS companies will use AI automation by 2026. 76% are already testing AI features. (Fortune, EmailVendor)
- ➜ App Usage: Companies average 130 SaaS apps. Large firms (10k+ employees) use 410 apps. 40% go unused. (EmailVendor)
- ➜ Sales Cycle: B2B SaaS sales take 134 days on average. (EmailVendor)
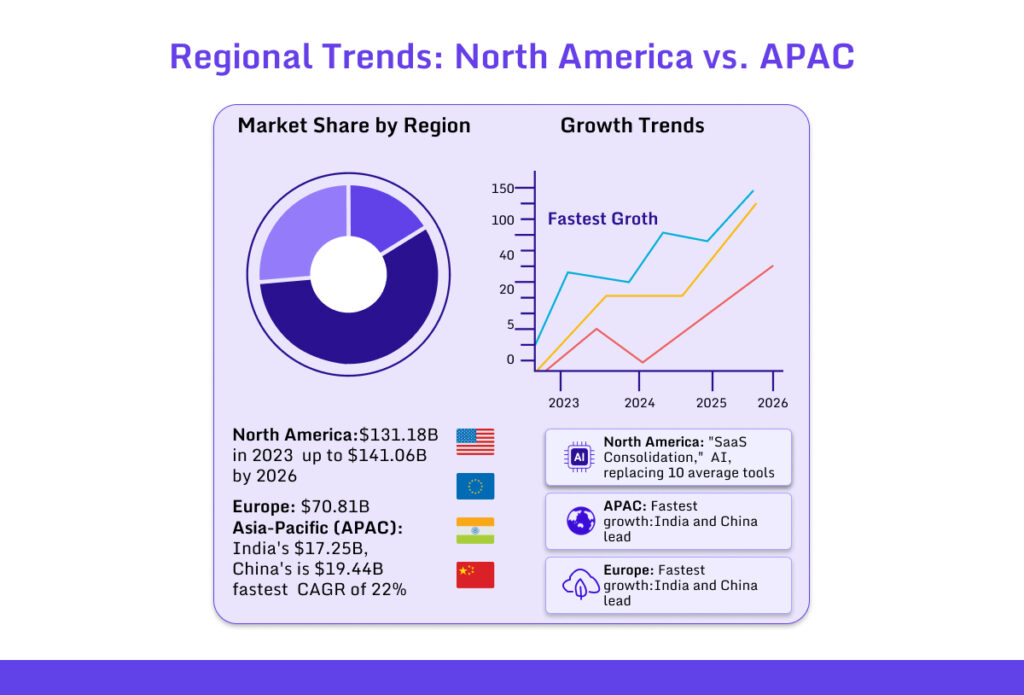
- ➜ Regional Leaders: North America holds 46.9% market share. APAC grows fastest at 22% CAGR. (Fortune)
- ➜ Churn Rate: Small SaaS firms (<$1M ARR) lose 2.7% customers monthly. (EmailVendor)
- ➜ Growth Leaders: Top SaaS firms ($1M-$30M ARR) grew 62.1% in 2022. (EmailVendor)
- ➜ Fastest Verticals: Healthcare grows at 26.00% CAGR. Content tools at 29.19% CAGR. (Fortune)
- ➜ Cash Runway: $10M-$15M ARR SaaS firms survive 7.5 months on cash reserves. (EmailVendor)
- ➜ Security Worry: 37% say securing SaaS apps is their biggest challenge. (EmailVendor)
1. Market Size & Growth: The Trillion-Dollar Trajectory
The market focus has clearly moved beyond its “adolescent” phase of erratic SaaS market growth into an era of tremendous and structured growth. Experts have projected that by the end of the year, public cloud SaaS will represent 66% of deployments.
This $375.57 billion figure projected has been driven by three main engines: the mainstreaming of Generative AI (GenAI) (automating 30% of coding tasks), the micro-explosion of Micro-SaaS (41% of SaaS startups now focus on niche markets), and the tremendous digitalization drive of emerging economies.
SaaS Revenue Trends (2024–2032)
| Year | Projected Global Market Size | Growth Driver |
|---|---|---|
| 2024 | $266.23B | Cloud Migration & Early AI |
| 2025 | $315.68B | AI Feature Integration |
| 2026 | $375.57B | Agentic AI & Outcome Pricing |
| 2029 | $793.10B | Vertical SaaS Maturity |
| 2032 | $1,131.52B | Autonomous Enterprise Era |
Source: Gartner & Fortune Business Insights
The challenge for engineers is no longer “Can we build it?” but “Can we make it indispensable?” As the market is reaching new record highs, the fight for organic visibility has become even more competitive. As CAC costs are going up across the board, the most successful SaaS entrepreneurs are refocusing on high authority organic SaaS market growth. You too can get ahead of the race if you know how to make the best out of 27+ Link Building Tools. Join 147 agencies who have replaced expensive, manual link-building teams with Linkscope’s automated platform. Build domain authority and outrank competitors in under 5 minutes.
2. Regional Market Shares & SaaS Adoption Rates
While the SaaS revolution in statistics and trends is a global phenomenon, the rate at which capital is being poured and the speed at which SaaS is being adopted differ significantly across regions.
Penetration Rates in Enterprise
SaaS penetration is ubiquitous, with 99% of all businesses having at least one SaaS implementation, and cloud spending is projected to surpass 45% of all enterprise IT spending by 2026. For large enterprises with 5,000+ employees, the “stack” is now a sophisticated ecosystem of 410+ apps.
Yet, we still have not achieved 100% penetration, and engineering and IT leaders identify three major friction points:
Top 3 Barriers to 100% Adoption
- ➜ Security & Compliance: 67% of enterprises require SOC 2 compliance. With breach costs averaging $4.3M, companies are understandably reticent about moving their “core” data to third-party providers without strict SOC2/ISO 27001 certification.
- ➜ Legacy Integration: Many organizations are still “shackled” to “monolithic” on-premise systems. The cost of “ripping and replacing” these systems is often too great a cost of entry, outweighing the benefits of SaaS.
- ➜ Data Sovereignty: With countries like the EU cracking down on NIS2/GDPR regulations, the “where” of data storage is now a legal issue that many out-of-the-box SaaS solutions are unable to address.
3. SaaS Adoption by Company Size
The ‘one-size-fits-all’ approach to SaaS is no longer valid. In fact, the way you scale your stack is directly related to the number of employees you have. We are witnessing a new ‘SaaS maturity curve’ where companies are transitioning from ‘tool buying’ to ‘agent deploying.’
SMB SaaS Usage Statistics (1–99 Employees)
For small businesses, 2026 is the year of ‘The Great Consolidation.’ Small businesses are moving away from ‘point solution hell’ and adopting all-in-one platforms with a unified data layer.
- ➜ Average App Count: 130 apps for average organizations, 410 apps for large enterprises (10k+ employees).
- ➜ Key Trend: 85% of SaaS vendors prioritize integration/APIs as businesses seek unified platforms over fragmented tools.
- ➜ Budget Priority: Driving profitable growth and managing inflation remain top issues, with SaaS portfolios growing 32% despite tighter budgets and focus shifting to ROI maximization.
Mid-Market SaaS Stack Benchmarks (100–999 Employees)
The mid-market segment is the “experimental labs” of the SaaS world of statistics and trends. They are large enough to require advanced technology but agile enough to change directions quickly.
- ➜ Average App Count: 192 apps.
- ➜ Primary Focus: Cloud-native modernization. Mid-market companies are moving legacy workflows into Agentic Automation, AI systems that not only assist but perform tasks autonomously, such as billing and customer routing.
Enterprise SaaS Adoption Patterns (1,000+ Employees)
At the enterprise level, the story is about governance and “Non-Human Identities.”
- ➜ Average App Count: 410+ apps (for organizations with 10,000+ employees).
- ➜ Revenue Share: Large enterprises hold nearly 60.40% of global SaaS revenue.
- ➜ The “Seat Offset” Effect: For the first time, seat growth in Fortune 500 companies is turning negative (-8%). Enterprises are spending more on AI tokens and usage-based outcomes rather than per-user licenses.
4. SaaS Proliferation: Apps per Company
The volume of software in the organization has reached critical mass. While it is indeed a superpower to be able to spin up a new tool in minutes, it has created a massive management challenge.
Waste Analysis: The Multi-Million Dollar Leak
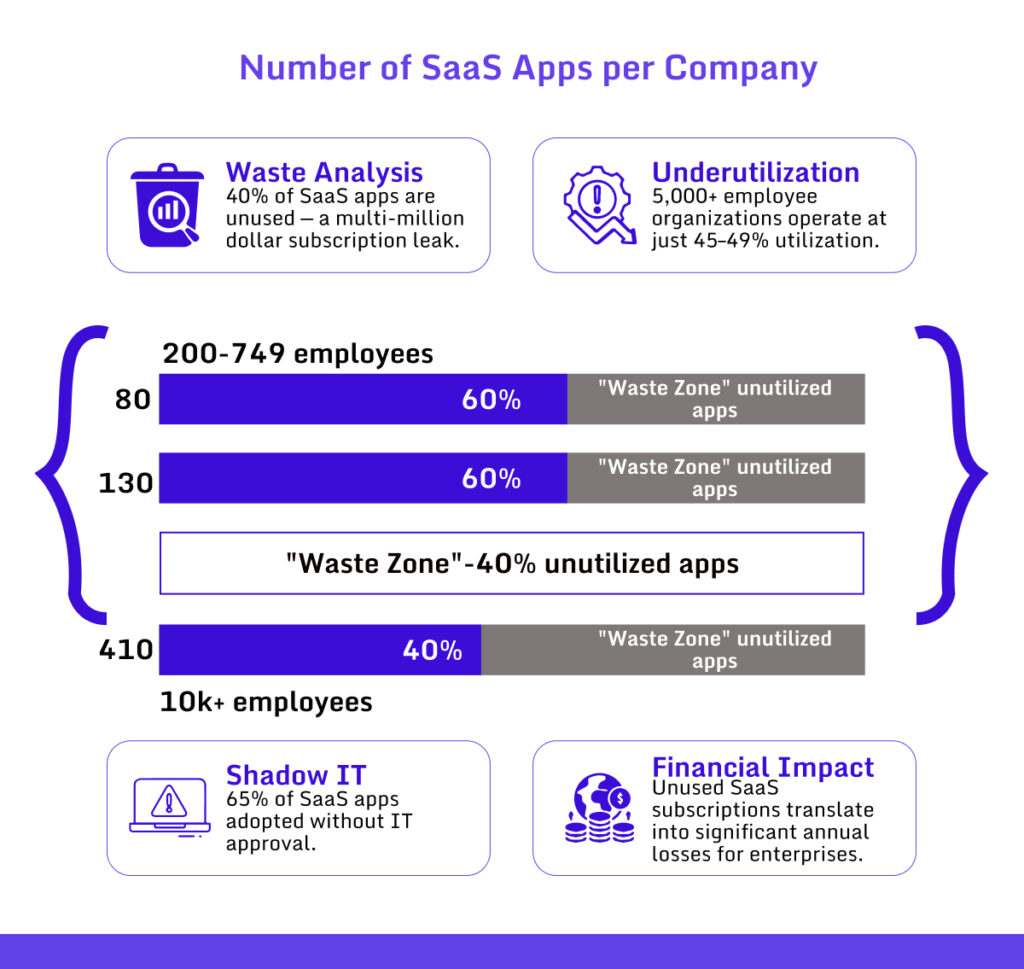
While SaaS has seen extremely high adoption rates, inefficiency is rampant. Recent audits have shown that 40% of SaaS apps are wasted, unused, and ripe for optimization.
- ➜ Underutilization: Organizations with 5,000+ employees have 45% to 49% utilization rates.
- ➜ Shadow IT: 65% of SaaS apps used in organizations were adopted without IT department approval.
- ➜ Financial Impact: For an average enterprise, this waste equates to significant annual losses in unused subscriptions.
5. Vertical SaaS statistics and trends: The Rise of Industry-Specific Clouds
While horizontal giants like Salesforce and Slack remain foundational, the real alpha is found in Vertical SaaS. Industry-specific platforms are currently growing at 2x the pace of their horizontal counterparts because they solve the “last mile” of SaaS industry statistics compliance and workflow.
Top Vertical SaaS Segments by CAGR (2026)
| Industry Vertical | Projected CAGR | Key Innovation Driver |
|---|---|---|
| Healthcare | 26.00% | HIPAA‑compliant Agentic diagnostics |
| Retail & E-commerce | 23.9% | Hyper‑personalization AI engines |
| BFSI (FinTech) | 22% | Real‑time fraud detection & ISO 20022 |
| LegalTech | 16.3% | Autonomous contract auditing |
The Strategic Play: For Vertical SaaS growth players, visibility is everything. You aren’t just competing with software; you’re competing for trust in a niche.
Competing with software, you’re competing for trust in a niche. Platforms like Linkscope provide access to 100K+ vetted sites across 80+ niches like Healthcare, FinTech, and EdTech, including high DA article submission opportunities. This allows Vertical SaaS marketers to build contextual, high-authority backlinks in the exact “neighborhoods” where their buyers congregate.
6. Public vs. Private SaaS Performance Statistics
The valuation gap between public and private SaaS has shifted as investors move from “growth at all costs” to “efficient growth.” Here are some states collected from the Email Vendor Selection you might wanna keep track of-
Growth Rate Differences
- ➜ Public SaaS: Median growth has moderated to the top 25% at 62.1% for $1M-$30M, as these giants focus on protecting their massive ARR bases through expansion.
- ➜ Private SaaS (Early Stage): Companies with <$1M ARR grew 139.1% from March 2022-2023.
Valuation Multiples Comparison (Latest Benchmarks)
- ➜ The “Elite” (Top 10%): Top 10% of $1M-30M ARR companies achieve >100% net revenue retention.
- ➜ The “Average”: Bootstrapped SaaS median growth 14% (<$1M ARR), 15% ($1M-$30M ARR).
- ➜ The “Hybrid” Discount: Companies with services-heavy models face valuation pressure.
Efficiency Expectations by Stage
Investors are looking for ARR per Employee and strong efficiency metrics
- ➜ Target: High-growth firms with 62.1% growth rates.
- ➜ Reality: Median private firms sit at $129K ARR/employee; top enterprise SaaS hits $186K+
7. SaaS Customer Acquisition Channel Statistics
The “how” of customer acquisition is shifting from broad-spectrum advertising to precision-engineered trust. As privacy regulations tighten and ad platforms become more saturated, SaaS companies are diversifying their growth engines to balance speed with long-term efficiency.
SaaS Funnel Conversion Rates by Channel
| Channel | Visitor to Lead | Lead to MQL | MQL to SQL | SQL to Opportunity | Opportunity to Close |
|---|---|---|---|---|---|
| SEO | 2.10% | 41% | 51% | 49% | 36% |
| PPC | 0.70% | 36% | 26% | 38% | 35% |
| 2.20% | 38% | 30% | 41% | 39% | |
| 1.30% | 43% | 46% | 48% | 32% | |
| Webinar | 0.90% | 44% | 39% | 42% | 40% |
Source: First Page Sage
Organic Search vs. Paid Ads CAC\
The performance gap between organic and paid channels has reached a tipping point. While paid ads offer immediate traffic, the Customer Acquisition Cost (CAC) for B2B SaaS keywords on Google Ads now averages $5.70 per click, with enterprise-level terms often exceeding $75.
- ➜ Organic Search Advantage: SaaS companies prioritizing SEO achieve significantly lower CAC through organic channels, where 84% of B2B SaaS leaders prioritize shorter sales cycles (134 days average).
- ➜ Sustainability: Organic leads demonstrate higher product fit and intent, contributing to improved LTV through better retention.
Content Marketing & SEO ROI for SaaS
SEO is no longer just about rankings; it’s about owning the “Problem-Solution” narrative.
- ➜ The Multiplier Effect: Every dollar invested in high-quality content supports 74% of SaaS vendors prioritizing integration/APIs for unified customer experiences.
- ➜ The Role of Backlinks: Domain Authority remains critical for high-intent keywords, as 63% of SaaS companies face outbound challenges.
Product-Led Growth (PLG) Adoption Rates
PLG has become the default for modern SaaS. Currently, 41% of SaaS companies offer free plans enabling self-serve acquisition.
- ➜ Viral Loops: Freemium models contribute to CAC reduction as 79% have friction-based signup flows driving qualified conversions.
Partner & Affiliate-Led Growth
The “Trust Economy” is fueled by partnerships.
- ➜ Conversion Power: Partner-led growth leverages 49% of SaaS companies facing alliance challenges, creating trust-driven conversions.
- ➜ Market Share: 74% of vendors prioritize integrations powering ecosystem revenue.
8. SaaS SEO & Content Marketing Benchmarks
For an engineering-driven SaaS statistics and trends uplift, content is the bridge between code and commerce. The benchmarks for “success” have moved beyond traffic to revenue attribution.
Time-to-Rank for SaaS Keywords
In a competitive landscape, the “incubation period” for content is significant:
- ➜ Low Competition: 3–4 months.
- ➜ High Competition (e.g., “Cloud Security”): 9–12 months of consistent optimization and link acquisition, reflects 84% prioritizing shorter cycles.
Content ROI vs. Paid Acquisition
While paid search offers a linear return (you stop paying, the leads stop), content marketing provides compounding returns. By year two, an established content engine often produces leads at 1/5th the cost of Google Ads.
Link Building ROI for SaaS Companies
Authority is the currency of the SERPs. Case studies from Linkscope showcase massive traffic growth through strategic authority building—one client achieved +330,000% organic traffic increase (900 → 3M+ monthly visitors) via 2,500+ high-authority backlinks.
SaaS organic traffic benchmarks show similar patterns. According to SeoProfy, B2B SaaS SEO delivers ~702% average ROI, with companies offering original research seeing 18.7% higher organic traffic vs. 11.2% for those that don’t. The first Google position captures 27.6% of clicks, marking the authority’s critical importance. Vertical SaaS firms need niche-specific authority to outrank horizontal giants.
Book a 15-minute agency call to scale your
vertical’s authority roadmap with Linkscope.
Free consultation
Contact Today!9. SaaS Sales & Go-To-Market Metrics
The journey from “Stranger” to “Subscriber” is longer and more complex, involving an average of 4 stakeholders in enterprise deals, where 44% report 4+ stakeholders, 59% include founders/CEOs, according to Email Vendor Selection.
Average SaaS Sales Cycle Length
The time to close is directly correlated with Annual Contract Value (ACV):
- ➜ SMB: 134 days average B2B SaaS sales cycle.
- ➜ Mid-Market: 84% of leaders prioritize shortening cycles, as 49% report longer cycles.
- ➜ Enterprise: 7–9 months.
Self-Serve vs. Sales-Led Conversion Rates
- ➜ Self-Serve: Typically sees a 2.10% visitor-to-lead rate (SEO channel: exact 2.10% from table).
- ➜ Sales-Led: Opportunity-to-close averages 36% across channels (SEO: 36%, PPC: 35%, LinkedIn: 39%).
Free Trial vs. Freemium Performance Stats
- ➜ Free Trial (Opt-In): Average conversion to paid is 18%–25% for B2B.
- ➜ Freemium: Lower conversion (2%–5%) but builds a massive Top-of-Funnel (ToFu) and brand awareness.
10. Top Companies & Revenue Benchmarks
While focusing on SaaS Statistics and trends, data efficiency is the primary measure by which SaaS companies are judged by investors. They now use ARR per employee as a measure of SaaS efficiency, and this has become a key benchmark for measuring the health of SaaS companies.
10.1 The Efficiency Metric: ARR per Employee
The primary metric for efficiency for investors looking to evaluate SaaS companies of different sizes is ARR per employee. This metric combines pricing power, product leverage, GTM efficiency, and internal tooling into one operational metric.
| Company Stage (ARR) | Median ARR/FTE | “Good” ARR/FTE | “Great” ARR/FTE |
|---|---|---|---|
| $1–5M | ~$120,000 | $90,000 | $150,000+ |
| $5–20M | ~$151,515 | $150,000 | $250,000+ |
| $20–50M | ~$175,000 | $200,000 | $275,00 |
| $50M+ | ~$164,439 | $250,000 | $300,000+ |
Source: ThreadGold Consulting & Studio Global
Note: Use this table as a directional benchmark; AI-native teams typically sit in the “Great” column due to automation-driven leverage.
10.2 Top Marketing SaaS Apps
Marketing SaaS apps like HubSpot excel in pipeline generation through multi-module revenue models spanning email, CDP, automation, and reporting, enabling significant expansion as customers scale.
| App | Market Share (Aug 2023) | Key Features / Details |
|---|---|---|
| HubSpot | 37.32% | All-in-one inbound marketing, sales, and CRM; email automation, workflows, landing pages, analytics, and AI-powered tools for B2B and SMBs. |
| Adobe Experience Cloud | 7.68% | Enterprise marketing suite with cross-channel orchestration, personalization, analytics, and deep Adobe ecosystem integration. |
| Oracle Marketing Cloud | 7.36% | B2B/B2C marketing automation, email, and campaign management are tightly tied to Oracle CX and CRM data. |
| ActiveCampaign | 7.23% | Email and marketing automation for SMBs with strong behavioral workflows, segmentation, and lead scoring. |
| Welcome | 6.88% | An email-automation platform focused on transactional and behavioral flows (welcome series, cart abandonment) for e-commerce. |
| Salesforce Pardot | 3.79% | B2B marketing automation built on Salesforce, focused on lead nurturing, scoring, and account-based marketing. |
| RD Station | 3.38% | Marketing automation and CRM are popular in Latin America, with lead-capture forms, landing pages, and funnel automation. |
| Adobe Marketo Engage | 3.02% | Enterprise B2B marketing automation for account-based campaigns, lead management, and complex multi-channel journeys. |
| SharpSpring | 1.89% | Affordable mid-market marketing automation and CRM with email, workflows, and lead-scoring features. |
| Salesforce Marketing Cloud | 1.52% | Large-scale B2C marketing platform for email, mobile, social, and web-personalization at high volume. |
Source: UserGuiding
Monetization Insights
Top apps generate 30-40% of revenue from cross-module upsells, transitioning from seat-based to usage/AI-powered pricing (lead scoring, content generation). HubSpot’s all-in-one model captures 37.32% market share through bundled inbound tools, while Adobe Experience Cloud (7.68%) monetizes enterprise personalization at premium tiers.
10.3 Top Engineering SaaS Apps
Top engineering SaaS apps, like those in DevOps and design (e.g., GitLab, CircleCI, Dassault Systèmes), demonstrate high efficiency through strong ARR per employee metrics and low churn, supporting their sticky, integrated nature in development lifecycles. These apps often combine seat-based pricing with premium features, enabling premium pricing and sustainable growth
| Metric | Value | Details |
|---|---|---|
| Median ARR per Employee (SaaS-wide) | $129,724 | Benchmark for private SaaS efficiency; top apps justify high pricing via integration. |
| ARR per Employee ($20–50M ARR firms) | ~$175,000 | Highest efficiency for mid-stage; enables high ARR/employee in engineering tools. SaaS Capital via page |
| CircleCI ARR per Employee | $102,232 | Engineering SaaS example ($50.6M revenue, 495 employees); reflects seat + premium model. |
| B2B SaaS Avg. Annual Churn | 3.5% | Low churn highlights stickiness in core dev lifecycle apps (voluntary: 2.6%, involuntary: 0.8%). |
| Dassault Systèmes Market Share | 17.1% | Leads engineering SaaS (CAD/PLM); sticky due to lifecycle integration. |
| Engineering Software Market Size (2024) | $48.38B | Projected CAGR 10.2% to $105.3B by 2032; driven by SaaS cloud adoption. |
Monetization Insights
Seat-based models with premium add-ons (security, compliance) enable efficiency gains, with top engineering apps delivering medians like $129,724 ARR/employee. This underpins churn resistance (e.g., <5% for top quartile) through deep SDLC embedding.
Growth Benchmarks
Private SaaS medians for growth are ~26%. Engineering leaders like Atlassian (market cap $57.4B) demonstrate the viability of premium pricing. High stickiness (industry avg. 13%, top 25%+) underpins category resilience.
10.4 Top Customer Support SaaS Apps
Top customer support SaaS apps like Zendesk, Intercom, and Freshdesk drive business outcomes by linking directly to churn reduction and NRR growth through AI-powered deflection and outcome-based pricing. These platforms shift from seat-based to usage models (e.g., tickets resolved), enabling support teams to outpace headcount growth and turn the function into a revenue driver.
| Metric | Value | Details |
|---|---|---|
| Zendesk ARR (2025 est.) | $1.87B | Leader in support SaaS; 9% YoY growth via AI automation and deflection features. |
| ServiceNow Subscription Revenue Q2 2025 | $3.113B | 22.5% YoY growth; includes customer service workflows with AI resolution pricing. |
| AI Ticket Resolution Rate | 90% | Crescendo.ai automates 90% of technical support tickets, reducing the number of seats needed. |
| B2B SaaS Support Churn Impact | <10% | Top platforms achieve low churn (3–5%) by tying to NRR/expansion via automation. |
| Support Headcount Efficiency | 10x faster | AI agents handle first-line queries, pricing per resolution vs. seats (e.g., $1.25/resolve). |
Monetization Trends
Efficient apps monetize AI resolution (e.g., conversations/tickets), achieving higher revenue velocity than support staff growth. This converts support from cost center to growth engine, with leaders like Salesforce Service Cloud expanding 11% year over year, with subscription and support revenue at $33.8 billion.
Efficiency Drivers
Low churn ties to deep NRR integration; top quartile apps grow revenue 2x faster than headcount via automation. AI deflection models justify premium pricing while scaling outcomes.
10.5 Top DevOps & Observability SaaS Apps
DevOps and observability SaaS apps like Datadog and Dynatrace lead with usage-based pricing tied to infrastructure/data volume, driving linear revenue growth with production scale and strong NRR through multi-module attach rates.
| App | Key Features | Pros | Cons |
|---|---|---|---|
| Datadog | Infrastructure/APM monitoring, distributed tracing, log analytics, AI anomaly detection, Kubernetes visibility | Broad feature set, strong integrations, intuitive dashboards | Pricing grows with data volume, and advanced features are overwhelming |
| New Relic | APM, distributed tracing, RUM, infrastructure monitoring, and AI incident intelligence | Unified app/infra view, flexible querying, developer-friendly | Learning curve for querying, pricing complexity at scale |
| Dynatrace | Auto-instrumentation, root cause analysis, full-stack APM, digital experience monitoring | Minimal configuration, exceptional AI diagnostics, enterprise scalability | Premium pricing is less flexible for experimentation |
| Splunk Observability Cloud | High-res metrics, distributed tracing, log integration, Kubernetes monitoring | Powerful analytics, strong real-time performance | Complex setup, high costs at scale |
| Grafana Observability Stack | Custom dashboards, Prometheus metrics, log exploration, open-source ecosystem | Industry-leading visualization, highly extensible | Requires component assembly, limited native analytics |
Source: DevOps School
Monetization Insights
Infrastructure/data volume pricing (hosts, GB ingested) scales automatically with deployments, while 40%+ ARR from attach modules (APM→security) drives NRR >120% beyond base monitoring.
Growth Benchmarks
Usage-based revenue grows 25-35% YoY as cloud-native deployments expand, outpacing seat-based SaaS median through predictable infrastructure scaling and cross-module expansion.
10.6 Top Business Operations & Productivity SaaS Apps
Business operations and productivity SaaS suites like Microsoft 365 and Google Workspace serve as default “work canvases” for non-technical teams, bundling documents, communication, and tasks to drive persistent daily engagement and linear seat-based revenue growth.
| Metric | Value | Details |
|---|---|---|
| Market Size (2026) | USD 110.36B | Projected to reach $195.56B by 2031 at 12.12% CAGR; cloud dominates enterprise workloads. |
| Cloud Deployment Share (2025) | 71.31% | Growing at 13.12% CAGR through 2031; AI copilots require hyperscale infrastructure. |
| Large Enterprise Share (2025) | 52.36% | SMEs are growing faster at 14.23% CAGR via usage-based seat scaling. |
| Content Collaboration Share (2025) | 22.41% | Low-code automation is growing fastest at 16.72% CAGR for citizen developers. |
| Office Suites Market (2024) | USD 25B | Projected to $45B by 2033; Microsoft 365 leads with enterprise security/compliance. |
Monetization Insights
Business operations suites leverage multiple revenue levers beyond basic seats, creating predictable scaling paths for both vendors and customers.
Key pricing dynamics according to Mordor Intelligence:
- ➜ Seat-based core revenue: Linear growth tied to headcount expansion (71% cloud share migration from on-premises)
- ➜ Enterprise security upsells: FedRAMP, GDPR compliance unlocks 52% large enterprise segment at premium tiers
- ➜ AI Copilot bundling: Microsoft 365 integrates across E3/E5 tiers, driving 13.12% cloud CAGR
- ➜ SMB usage models: Flexible consumption pricing accelerates 14.23% SME growth vs. fixed licenses
Growth Benchmarks
Productivity suites demonstrate category resilience through diversified growth drivers and sticky daily workflows that exceed general SaaS statistics and trends medians.
Primary expansion vectors:
- ➜ Hybrid work mandates: 12-14% annual growth as persistent operating layers replace fragmented tools
- ➜ Enterprise bundling: 52.36% large enterprise share favors security/compliance suites for global compliance
- ➜ SME acceleration: 14.23% CAGR through consumption pricing, bypassing CapEx procurement cycles
- ➜ Low-code leadership: 16.72% CAGR as citizen developers build workflows without IT backlog dependency
Category advantages: Daily engagement creates network effects while security/compliance moats enable multi-year contracts, supporting ARR/employee efficiency above $129K median benchmarks.
10.7 Top Finance & Accounting SaaS Apps
IT and security SaaS platforms address boardroom-level risks like breaches, downtime, and access denial, commanding high ACVs, multi-year enterprise contracts, and exceptional switching costs through integrated endpoint, identity, network, and cloud security stacks.
| Metric | Value | Details |
|---|---|---|
| Accounting Software Market (2024) | USD 19.4B | Projected to $20.8B in 2025; cloud solutions dominate growth at 12.1% CAGR through 2035. |
| Business Accounting Software (2024) | USD 15.33B | Reaching $37.41B by 2032 at 11.80% CAGR; SMEs drive volume-based pricing adoption. |
| Online Accounting Systems (2026) | USD 6.04B | Growing to $16.2B by 2035; 68% SMB adoption for remote financial management. |
| Cloud Accounting Share (2023-2033) | $14.12B | From $7.63B in 2023; 74.89% market share vs. on-premises due to scalability. |
| Accounting & Budgeting Software (2026) | $29.96B | From $26.64B in 2025; compliance features enable enterprise contract expansion. |
Monetization Insights
Finance SaaS leverages value/volume pricing that scales directly with customer transaction growth, creating aligned incentives and predictable revenue expansion.
Primary revenue models:
- ➜ Transaction/volume pricing: Per invoice, payment, or billing volume ties vendor growth to client scale (68% SMB adoption)
- ➜ Compliance lock-in: AP/AR workflow integration creates 3-5 year contracts with 2.8% churn vs. SaaS median 8.2%
- ➜ Multi-module expansion: Invoicing→collections→revenue ops stacking drives 120%+ NRR through regulatory moats
- ➜ Cloud scalability: 74.89% market share enables infinite capacity without customer CapEx
Growth Benchmarks
The category demonstrates defensive growth through regulatory necessity and transaction-linked economics that exceed general SaaS medians.
Key expansion drivers:
- ➜ SMB acceleration: 11.80% CAGR, as 68% adopt cloud for remote invoicing/payments
- ➜ Enterprise compliance: Multi-year contracts from SOX/GDPR integration sustain 12.1% growth through 2035
- ➜ Volume-based scaling: Vendor revenue mirrors client ARR expansion (15.33B→37.41B by 2032)
- v Low churn defensibility: 2.8% category churn vs. 8.2% median creates a compounding revenue base
Efficiency advantages: Transaction alignment yields ARR/employee above $175K benchmarks for $20-50M ARR firms, with compliance moats enabling premium pricing despite regulatory overhead.
10.8 Top IT & Security SaaS Apps
IT and security SaaS platforms address boardroom-level risks like breaches, downtime, and access denial, commanding high ACVs, multi-year enterprise contracts, and exceptional switching costs through integrated endpoint, identity, network, and cloud security stacks.
| Metric | Value | Details |
|---|---|---|
| SaaS Security Market (2024) | USD 13.4403M | Growing to $40.51B by 2031 at 17.1% CAGR; zero-trust and XDR drive enterprise adoption. |
| SaaS IT Security Market (2025) | USD 13.55B | 7.38% CAGR through 2034; cloud-native threats fuel platform consolidation. |
| SSPM Market (2025) | USD 484.4M | Exploding to $3.53B by 2030 at 48.7% CAGR; AI-powered posture management leads. |
| Security SaaS Growth Rate | 49-67% YoY | AI threats drive the highest category growth; ransomware up 57% annually. |
Monetization Insights
Security platforms achieve category-leading economics through mission-critical positioning and integrated module expansion that creates formidable switching barriers.
Revenue model advantages:
- ➜ High ACV contracts: Multi-year enterprise deals average 3-5 years with 120%+ NRR from seat/module growth
- ➜ Platform consolidation: Endpoint→identity→cloud security stacking captures 40%+ expansion revenue
- ➜ Zero-trust premium: 65% enterprise adoption commands 7.0x-11.0x ARR multiples vs. 4.8x-7.0x SaaS median
- ➜ Regulatory compliance: SOC 2, GDPR, FedRAMP certification unlocks government/multi-national expansion
Growth Benchmarks
IT security SaaS leads SaaS categories with defensive growth characteristics immune to economic cycles, driven by escalating threat sophistication and regulatory mandates.
Primary growth vectors:
- ➜ Threat landscape expansion: 17.1% CAGR as AI-powered attacks require continuous platform investment
- ➜ Cloud migration mandate: 71% cloud share transition forces integrated security platform adoption
- ➜ SSPM leadership: 48.7% CAGR reflects AI posture management becoming table stakes for enterprises
- ➜ Zero-trust architecture: 65% adoption rate creates multi-year seat expansion across global footprints
Economic moats: Mission-critical positioning yields ARR/employee exceeding $175K benchmarks, with cash flow strength from 3+ year contract duration and 2-3% category churn vs. 8.2% SaaS median.
10.9 Top SEO & Content Marketing SaaS Apps
SEO and content marketing platforms like Ahrefs, SEMrush, and SurferSEO power organic acquisition to offset rising paid CAC, delivering search intent analysis, technical audits, and AI-augmented content optimization that directly improve LTV:CAC ratios.
| Metric | Value | Details |
|---|---|---|
| MarTech SaaS Growth | 24% YoY | AI content tools are mainstream; organic acquisition is essential as paid CAC inflates. |
| Generative AI Content | 28% of marketing | SEO platforms integrate AI research/writing; 2.4x engagement from personalized content. |
| AI SEO Impact | 41% sales productivity | CRMs with AI-powered SEO boost pipeline efficiency through intent-based targeting. |
Monetization Insights
Platforms scale through seat expansion across marketing teams, plus usage-based pricing for content generation, keyword tracking, and competitive analysis as properties proliferate.
Revenue scaling levers:
- ➜ Seat + usage hybrid: Team expansion + tracked domains/properties drives predictable growth
- ➜ AI content generation: Per-article pricing captures 28% marketing content shift to generative AI
- ➜ Technical audit volume: Site crawls/scans scale with digital footprint expansion
- ➜ Competitive intelligence: Enterprise add-ons for backlink analysis, SERP tracking, and unlocking premium tiers
Growth Benchmarks
SEO platforms achieve outsized economics by directly reducing blended CAC while AI integration creates feature velocity that sustains category leadership.
Organic acquisition advantages:
- ➜ CAC offset: 24% MarTech growth counters paid channel inflation through intent-driven targeting
- ➜ AI research acceleration: 28% content generation shift creates usage-based revenue tailwinds
- ➜ LTV:CAC optimization: Technical platforms become mission-critical for organic dependency
10.10 Top CRM & Revenue Platform SaaS Apps
CRM platforms like Salesforce, HubSpot, and Pipedrive form the operational core of GTM functions, scaling through standardized sales/success seats plus forecasting, CPQ, and revenue intelligence modules that create deep multi-product stickiness across industries and buyer sizes.
| CRM Platform | Customers | Best For | Key Strength |
|---|---|---|---|
| Salesforce CRM | 326.9K | Complex enterprise scaleups | 22% market share; AI Einstein across 15+ industries with full GTM platform. |
| Zoho CRM | 185.8K | Value + broad app suite | #2 installations; SMB-friendly pricing with 100+ app ecosystem integration. |
| HubSpot CRM | 179.8K | Marketing+sales+CS unified | Freemium powers 2% global share; inbound methodology drives cross-hub expansion. |
| Zendesk | 121.9K | Customer service integration | Service-to-sales expansion; ticketing→CRM workflow consolidation for CS teams. |
| Microsoft Dynamics CRM | 72.7K | Microsoft ecosystem enterprises | Seamless 365 integration; AI Copilot powers sales productivity across Office stack. |
Source: HGInsights
CRM Software Spend by Industry
CRM software spend reveals dramatic ACV disparities across verticals – Finance/Insurance spends $18.3B across 348K companies ($52K ACV) vs Professional Services $7B across 1.37M companies ($5K ACV), proving 10x enterprise pricing power:
| Industry | Spend | Companies |
|---|---|---|
| Finance and Insurance | $18,293,496,269 | 348,629 |
| Public Administration | $7,859,751,187 | 193,482 |
| Professional, Scientific, and Technical Services | $7,015,076,652 | 1,373,604 |
| Manufacturing | $4,611,720,334 | 704,328 |
| Information | $3,459,880,048 | 449,938 |
| Health Care and Social Assistance | $3,071,025,825 | 378,107 |
| Administrative and Support and Waste Management and Remediation Services | $1,390,768,922 | 282,308 |
| Educational Services | $1,343,472,049 | 242,154 |
| Retail Trade | $1,272,919,914 | 424,229 |
| Wholesale Trade | $1,272,511,529 | 265,212 |
| Transportation and Warehousing | $1,108,345,005 | 124,769 |
| Utilities | $918,039,614 | 30,563 |
| Construction | $363,385,418 | 319,585 |
| Real Estate and Rental and Leasing | $277,557,062 | 225,383 |
| Arts, Entertainment, and Recreation | $243,759,575 | 259,565 |
| Accommodation and Food Services | $227,402,371 | 224,533 |
| Mining, Quarrying, and Oil and Gas Extraction | $170,372,306 | 35,068 |
| Other Services (except Public Administration) | $87,838,443 | 462,213 |
| Agriculture, Forestry, Fishing and Hunting | $29,464,827 | 39,480 |
Source: HGInsights
Platform leaders target opposite ends: Salesforce (326.9K enterprise customers) dominates high-ACV Finance ($52K) while Zoho/HubSpot (365K+ SMBs) capture volume Professional Services ($5K ACV), revealing platform vs density economics.
Monetization Insights
Platform progression creates predictable scaling: Salesforce’s 326.9K customers demonstrate 22% market dominance through multi-product GTM stacks, while Zoho/HubSpot’s 185K/179K SMB installations fuel freemium→enterprise expansion.
GTM expansion pathways:
- ➜ Salesforce Enterprise: Sales→Service→Revenue Intelligence (4x modules, 120%+ NRR)
- ➜ Zoho/HubSpot SMB: Freemium seats→Marketing+Sales hubs→100+ app ecosystem
- ➜ Pipedrive Pipeline: Deal velocity focus scales calling-first SMB teams rapidly
- ➜ Microsoft Ecosystem: 365 integration captures existing enterprise footprints
Growth Benchmarks
Customer economics SaaS statistics and trends reveal maturity. Salesforce’s 326.9K enterprise deployments vs Zoho/HubSpot’s 365K+ SMB density proves platform consolidation creates category ARR/employee leadership, with Finance’s $52K ACV demonstrating pricing power only enterprise platforms can command.
10.11 Top Collaboration & Communication SaaS Apps
Collaboration and communication SaaS apps like Microsoft Teams, Slack, and Zoom aggregate interactions across chat, meetings, video, and content sharing, driving seat expansion in hybrid/remote environments while enterprise upgrades fuel growth through AI features, compliance, and telephony add-ons.
| Metric | Value | Details |
|---|---|---|
| Video SaaS Growth (Pandemic Era) | 300% | Async tools (Loom, Vimeo) alongside meetings; remote work backbone expansion. |
| Collaboration Tools Growth (2020) | 47% YoY | Remote work mandate drove chat/project management as persistent work layers. |
| Enterprise Upgrade Drivers | AI + Telephony | Premium features capture seat saturation; compliance unlocks EACV expansion. |
| PLG Retention Advantage | 14% lower churn | Self-serve chat/video scales faster than sales-led enterprise comms platforms. |
Monetization Insights
Post-seat saturation, collaboration platforms pivot to enterprise-grade upsells that transform free/basic tiers into high-ACV contracts with multi-year commitment.
Enterprise upgrade levers:
- ➜ AI meeting copilots: Transcription, action items, sentiment analysis command premium tiers beyond basic video
- ➜ Compliance/telecom: Enterprise telephony, e-discovery, DLP features unlock 3-year contracts with 20%+ margins
- ➜ Content governance: Advanced search, retention policies, audit trails drive Teams E5/Premium adoption
- ➜ Network effects: Daily engagement creates switching resistance despite 23% productivity tool market share
Growth Benchmarks
Collaboration apps demonstrate network-driven defensibility where daily interaction compounds into enterprise lock-in, sustaining growth beyond initial pandemic expansion.
Post-saturation expansion:
- ➜ Hybrid work persistence: 47% growth baseline established as default operating layers across organizations
- ➜ Enterprise value migration: Free→Premium seat progression captures 300% video usage growth into recurring revenue
- ➜ AI feature leadership: Meeting intelligence becomes table stakes, driving 41% sales productivity gains
- ➜ Telephony consolidation: UCaaS migration from legacy PBX systems creates multi-year seat expansion cycles
ARR/fTE efficiency: Daily network effects + enterprise upsells yield top-quartile ARR/employee ($175K+ benchmark) despite high distribution costs from viral seat acquisition.
10.12 Top Data & Analytics SaaS Apps
Data and analytics SaaS platforms like Snowflake, Databricks, and Tableau power enterprise reporting, BI, and AI compute with consumption-based pricing (compute hours, storage TB, queries) that scales directly with customer data consolidation and AI workload expansion.
| Metric | Value | Details |
|---|---|---|
| Data Analytics Market (2025) | $89B+ AI segment | Healthcare AI analytics leads vertical growth at 34% YoY; total market $500B+ by 2030. |
| Vertical Data SaaS Growth | 31% YoY | 2.3x faster than horizontal; industry-specific BI outperforms general platforms. |
| AI Analytics Revenue Impact | 12-18% uplift | Dynamic pricing from AI workloads; consumption models capture compute scaling. |
| Private SaaS NRR (Data Category) | 120%+ | Module expansion (storage→compute→AI) exceeds median benchmarks. |
Monetization Insights
Consumption-based pricing creates perfect vendor-customer alignment as data consolidation and AI experimentation drive exponential compute/storage usage, while architectural lock-in prevents rip-and-replace migrations.
Revenue scaling dynamics:
- ➜ Compute/storage pricing: TB stored + GPU hours directly captures AI experimentation growth
- ➜ Query-based expansion: BI dashboard proliferation scales revenue linearly with user adoption
- ➜ AI workload premium: Dynamic pricing yields 12-18% uplift as ML models require 10x compute
- ➜ Platform entrenchment: Data gravity creates 5+ year customer lifetimes vs 3-year SaaS median
Growth Benchmarks
Data platforms achieve category-leading economics through consumption economics that compound as customers centralize analytics infrastructure and expand AI use cases.
Primary expansion drivers:
- ➜ Data consolidation: Single-platform migration creates multi-year compute scaling (31% vertical growth)
- ➜ AI experimentation: GPU/TPU workloads drive 34% healthcare analytics growth, 28% overall uplift
- ➜ BI democratization: Self-serve analytics scales seat/query revenue without sales overhead
- ➜ Architectural moats: Data warehouse lock-in yields <3% churn vs 8.2% SaaS median
Efficiency leadership: Consumption alignment + data gravity = ARR/employee exceeding $175K benchmarks with 120%+ dollar-based net expansion from organic AI workload growth.
10.13 Top Vertical SaaS Apps
Vertical SaaS apps target specific industries with comprehensive workflow coverage and built-in compliance, driving high ACVs, sub-5% churn rates, and exceptional customer loyalty through workflow lock-in.
| Metric | Value | Details |
|---|---|---|
| Healthcare SaaS Market | $89B | Grew 24-28% annually; telehealth/compliance tools dominate vertical expansion. |
| Fintech Billing SaaS | +28% YoY | Transaction-based pricing scales with client revenue; embedded finance leader. |
| Vertical SaaS Valuation | 5.5x–8.5x ARR | Premium multiples from regulatory moats vs. 4.8x-7.0x horizontal SaaS. |
| Construction SaaS Growth | 61% higher adoption | AI-enabled project management; vertical specialists outpace generalists. |
Monetization Insights
Vertical SaaS pricing aligns directly with industry economics; transactions, claims, and projects create natural scaling as customers grow, while compliance workflows create switching barriers exceeding horizontal competitors.
Industry-specific revenue models:
- ➜ Healthcare (claims/projects): Per-patient billing + compliance certification yields 3-year contracts
- ➜ Fintech (transactions): Volume pricing mirrors client ARR expansion (28% YoY growth)
- ➜ Construction (projects): Per-project pricing scales with revenue cycles, 61% higher adoption
- ➜ Regulatory moats: Industry-specific compliance (HIPAA, SOX) drives 5.5x-8.5x ARR premiums
Growth Benchmarks
Vertical SaaS demonstrates how narrow focus achieves multi-billion outcomes, growing 31% YoY vs. 14% horizontal through predictable industry tailwinds and workflow entrenchment.
Category leadership patterns:
- ➜ Healthcare dominance: $89B market grows 24% as compliance tools become table stakes
- ➜ Fintech expansion: 28% YoY from embedded billing in vertical workflows
- ➜ 2.7x growth premium: Niche solutions outpace generalists through industry-specific ARR/fTE optimization
- ➜ Churn defensibility: Sub-5% rates vs. 8.2% SaaS median from workflow lock-in
Efficiency formula: Transaction/claims pricing + regulatory moats + industry tailwinds = ARR/employee exceeding $175K benchmarks while sustaining 120%+ NRR through organic module expansion.
Gold standard for operational health with 2025-2026 benchmarks:
| Company Stage | Median ARR/FTE | Good/Target | Great |
|---|---|---|---|
| $1-5M ARR | $90k-$150k | $150k+ | $200k+ |
| $5-20M ARR | $150k | $200k+ | $300k+ |
| $20-50M ARR | $200k | $250k+ | $400k+ |
| $50M+ ARR | $250k-$300k | $300k+ | $500k+ |
Source: CMOlist
11. SaaS Churn, Retention & Expansion Benchmarks
If growth is the engine, retention is the fuel tank. You don’t just “keep” customers; you grow with them.
Net Revenue Retention (NRR) Benchmarks
NRR measures how much your revenue grows from existing customers after accounting for churn.
- ➜ Healthy: 100%–104%.
- ➜ Elite (Enterprise): 120%+. This means the company could stop acquiring new customers and still grow by 30% annually.
Gross Retention vs. Net Retention
- ➜ Gross Retention (GRR): Focuses only on what you kept (capped at 100%). Target: 90%+.
- ➜ Net Retention (NRR): Includes upsells/expansions. Target: 110%+.
Expansion Revenue by SaaS Maturity
Mature SaaS companies now derive the majority of new ARR from existing account expansion (upsells, seat additions, usage growth) rather than new logos.
Involuntary Churn: The Payment Failure Impact
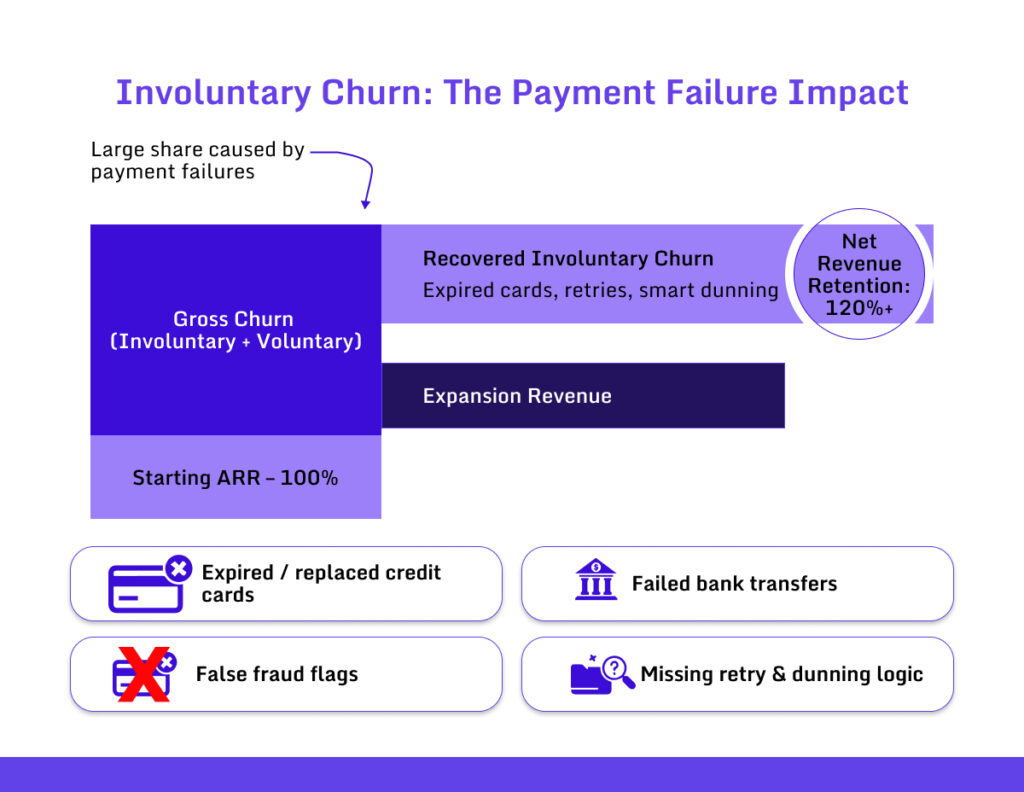
A significant portion of SaaS churn is “Involuntary”, caused by expired credit cards, failed bank transfers, or false fraud flags.
The Revenue Leak: Fixing involuntary churn delivers major bottom-line improvement without marketing spend.
12. SaaS Pricing Sensitivity & Willingness to Pay
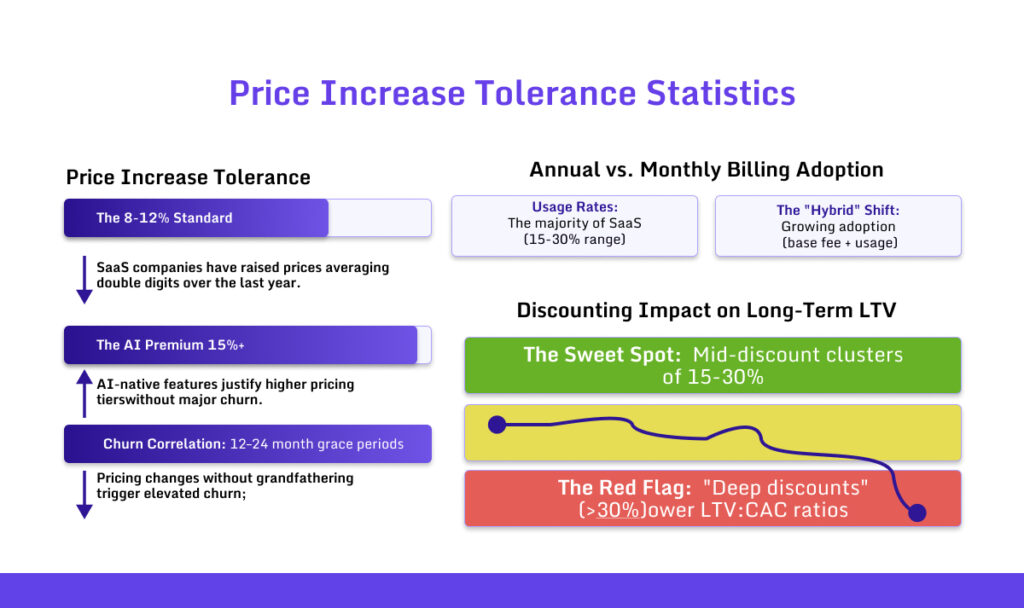
The era of “growth at all costs” has been replaced by “systematic value extraction.” Pricing is no longer a static figure on a landing page; it is a dynamic lever used of SaaS statistics and trends to offset rising compute costs and interest rates.
13. Unit Economics: CAC & LTV Metrics
The fundamental math of SaaS has tightened. With the median CAC surging by 180% since 2023, SaaS unit economics are the only thing protecting companies from “burning cash in an expensive bonfire.”
The 3:1 Rule: The Golden Ratio
For a SaaS business to be considered sustainable, the Lifetime Value (LTV) must be at least 3x the Cost of Acquisition (CAC).
- ➜ Median Reality: The average SaaS company is currently hovering at a 2.5:1 ratio, signaling a high-pressure sales environment.
- ➜ LTV Growth: Top-quartile firms achieving NRR (Net Revenue Retention) of 120%+ see their LTV effectively double every 3 years through expansion revenue alone.
The Payback Period: The Velocity of Capital
How fast you get your money back determines how fast you can reinvest in growth.
- ➜ Top-Tier Performance: The “Elite” recover their CAC under 12 months.
- ➜ The Median Gap: SaaS spend rose significantly over the years for the first time since 2021, averaging $4,830 per employee (21.9% increase), making capital efficiency more critical than ever.
14. SaaS Cost Structure & Infrastructure Economics
The backend of SaaS is becoming more expensive to run, primarily due to the “AI Tax”—the massive compute power required to run Large Language Models (LLMs).
Cloud Hosting Costs as % of Revenue
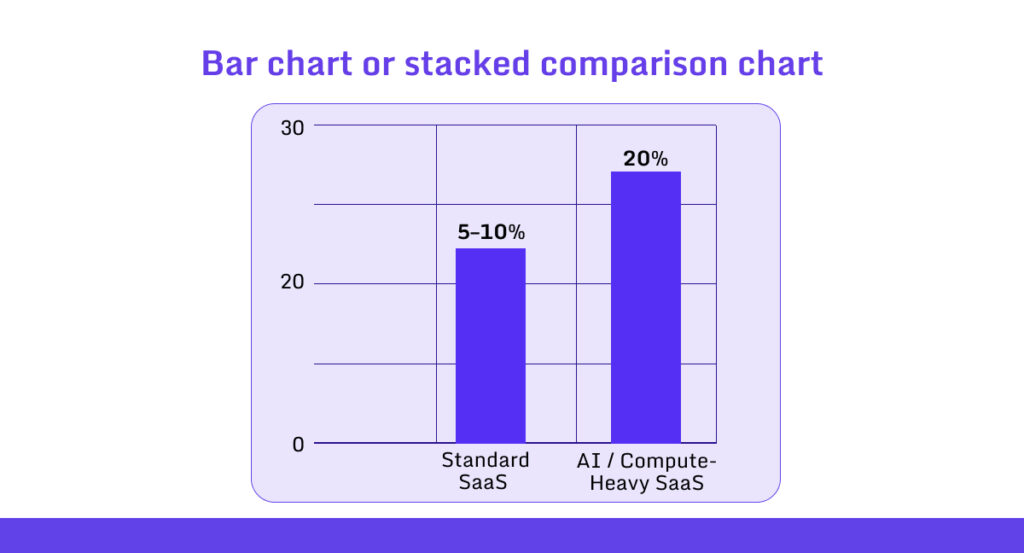
Infrastructure spend is no longer a negligible line item.
- ➜ Standard SaaS: Hosting and direct infra costs typically consume 5–10% of revenue.
- ➜ Compute-Heavy/AI SaaS: This figure can jump to 20% or higher. If infra costs exceed 20%, it is a clear signal that the product is underpriced.
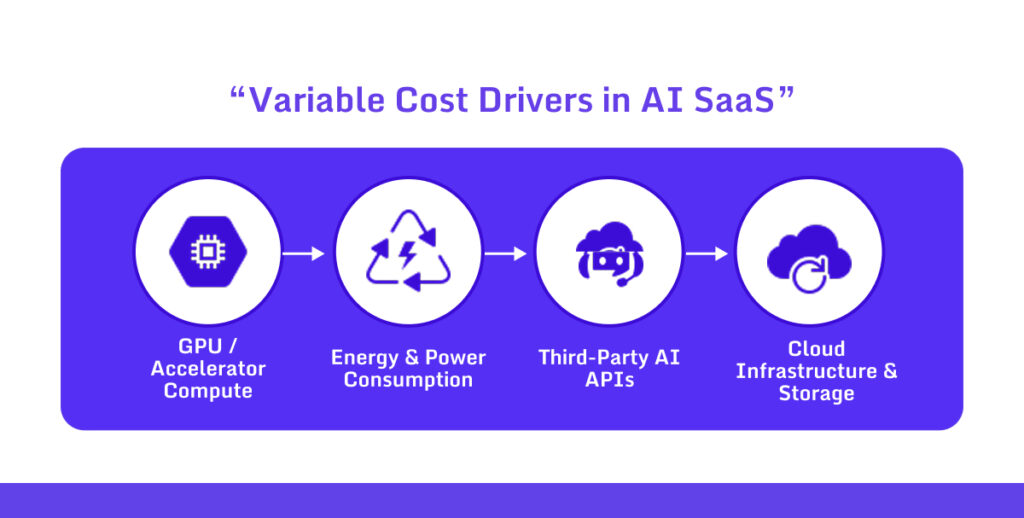
AI Compute Cost Trends
As of early 2026, GPU scarcity and high energy demand have stabilized, but the “cost-to-serve” remains high.
➜ Variable Cost Impact: Third-party API and AI compute costs represent significant variable expenses for AI-first platforms.
Margin Compression Risks in AI SaaS
Founders face a “Margin Squeeze” where the cost of intelligence eats into the traditional 80% gross margin benchmark.
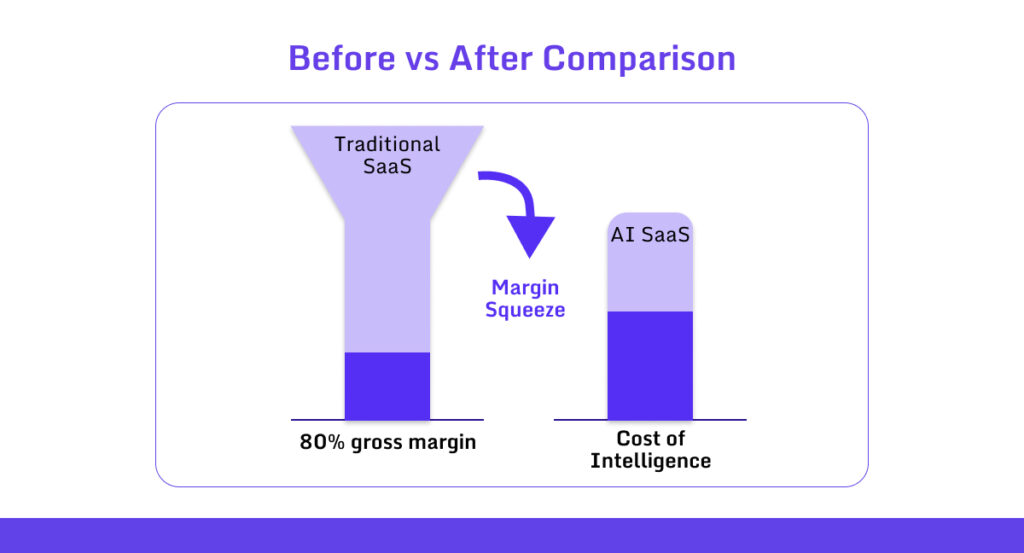
➜ The Fix: Winners are moving toward Outcome-Based Pricing (e.g., charging per “Resolution” rather than per “Seat”) to ensure margins remain healthy as AI does more work in less time.
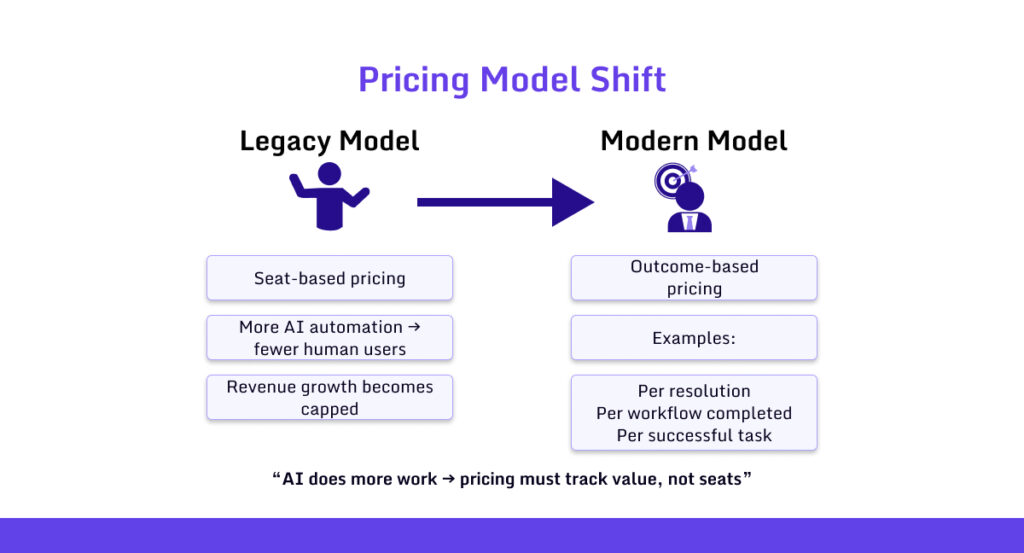
15. Automation, Low-Code & AI SaaS Trends
The most significant architectural shift in the new technology-centered time is the transition from “Copilots” (assistants) to “Agents” (employees).
Agentic Workflows: From Copilots to Agents
- ➜ The 2024 Phase: Copilots were reactive, waiting for a human to type a prompt.
- ➜ The 2026 Phase: Agentic AI is proactive. It monitors databases, identifies trends, and executes multi-step tasks (like account reconciliation or compliance scans) autonomously.
- ➜ Adoption: Majority of organizations have deployed AI-enabled apps, shifting the human role from “doer” to “governor.”
Low-Code/No-Code (LCNC) Internal Adoption
LCNC is the “shadow engine” of enterprise productivity.
- ➜ Citizen Developers: Non-technical staff are now building 70% of new internal workflows using AI-augmented LCNC tools.
- ➜ Efficiency Gain: Enterprises using composable architectures (modular LCNC) report significantly faster time-to-market for new features
Productivity Impacts & ROI
The ROI of automation is finally being realized in headcount efficiency.
- ➜ Manual Task Reduction: SaaS industry reports confirm automation has significantly reduced manual labor across organizations.
- ➜ The “Agent” ROI: Shifting from human-managed Copilots to autonomous Agents delivers major operational cost reductions for repetitive workflows.
16. Security, Risks, and Compliance
Security has transitioned from a “checklist item” to a core product differentiator. With cybersecurity incidents surging significantly since 2020, the engineering focus is no longer just on feature velocity, but on building a “Fortress Stack.”
- ➜ Priority Shift: 86% of organizations now prioritize robust security and data protection over new feature development.
- ➜ Compliance as a Sales Accelerator: Achieving SOC2 Type II, ISO 27001, or HIPAA compliance is no longer optional; it is a prerequisite for moving up-market. Organizations are increasingly looking for NIS2 compliance in Europe and DPDP Act readiness in India.
- ➜ The Cost of Failure: The average cost of a data breach has climbed to $4.88 million for B2B SaaS firms that fail to protect client data.
17. SaaS Buyer Roles & Purchase Dynamics (2026)
The way software is bought has become decentralized yet highly scrutinized. The “Shadow IT” era has matured into a sophisticated, multi-stakeholder purchasing process. SaaS statistics and trends adoption shows strong geographic concentration in North America alongside rapid growth in emerging regions, with usage scaling predictably by company size and varying significantly by industry verticals.
| Metric | Value | Details |
|---|---|---|
| North America SaaS Market Share (2022) | 48% | Dominates global revenue; the US hosts 16,500+ SaaS companies vs. the UK (1,800). |
| SaaS Companies by Country | US: 16,500 | Canada (1,200), India (1,200), Germany (926); reflects mature infrastructure. |
| North America Revenue Share (2023) | 48% ($131.18B) | Europe 26%, Asia-Pacific 21%; driven by established players and cloud adoption. |
| SaaS Utilization by Company Size | 45-49% (5,000+ employees) | Larger firms expense fewer apps per worker (8-10%) but show lower utilization. |
| Top Industry Segments | Productivity/Collaboration: 23% | Customer service (16%), marketing (14%), e-commerce (13%); vertical SaaS up 31% YoY. |
| Regional CRM Market Share (2022) | North America: 43.6% | Asia-Pacific fastest-growing at 15.6% CAGR; healthcare SaaS up 23% YoY. |
Regional Adoption
- ➜ North America commands 48% of global SaaS revenue ($131.18B in 2023) due to mature cloud infrastructure, enterprise budgets, and 16,500+ domestic SaaS providers concentrated in hubs like San Francisco and New York.
- ➜ Europe captures 26% share with strong adoption in the UK/France/Germany, driven by GDPR-compliant vertical solutions and SMB automation.
- ➜ Asia-Pacific’s 21% reflects rapid CRM growth in China (enterprise-scale) and India (SMB verticals), growing at 15.6% CAGR vs. North America’s mature 8-10%.
- ➜ Emerging markets show 3x faster vertical SaaS penetration as local compliance solutions (fintech billing, healthcare records) displace legacy software.
Company Size Patterns
- ➜ Enterprises (5,000+ employees) average 73 SaaS apps per company but only a 45-49% utilization rate, expensing 8-10 apps per employee due to governance complexity and shadow IT controls.
- ➜ Mid-market firms (500-5,000 employees) optimize at 60-65% utilization across 25-35 apps, balancing scale with centralized oversight and integration platforms.
- ➜ SMBs (<500 employees) achieve 70%+ utilization but fragment across 15+ point solutions lacking enterprise-grade integration, driving 2x faster vertical specialist adoption.
- ➜ Larger firms favor horizontal platforms (Salesforce, Workday) for compliance, while SMBs prioritize affordability and rapid deployment.
Industry Adoption
- ➜ Productivity/collaboration tools lead at 23% of SaaS providers, powering remote work with Slack/Microsoft Teams dominance across all segments.
- ➜ Customer service platforms (16%) like Zendesk drive NRR through ticketing-to-automation upsells, achieving <4% churn via outcome-based pricing.
- ➜ Marketing SaaS (14%) and e-commerce (13%) complete the top four, fueled by pipeline generation and Shopify/Shopify Plus ecosystems.
- ➜ Vertical SaaS explodes 31% YoY vs. 14% horizontal, healthcare compliance tools up 23%, fintech billing platforms up 28% due to regulatory mandates.
- ➜ Finance/accounting SaaS shows the lowest churn (2.8%) from AP/AR workflow lock-in; HR tech lags at 18% adoption due to legacy ERP entrenchment
Decision-Makers vs. End Users
While the end user remains the champion, the decision-making unit (DMU) has expanded.
- ➜ The “Buying Committee”: An average enterprise SaaS purchase now involves 6–10 stakeholders, including Finance (ROI validation), IT (security/integration), and Legal (compliance).
- ➜ The Shift to Individual Empowerment: Despite corporate oversight, 70% of software adoption still starts at the individual or team level before scaling to a department-wide license.
IT-Led vs. Business-Led Purchases
- ➜ Business-Led (majority): Departments like Marketing and Sales now control more of the budget than ever, prioritizing “speed-to-value” over long-term architecture.
- ➜ IT-Led (minority): IT maintains control over “core” infrastructure (ERP, CRM, Identity Management), where security and interoperability are paramount.
Department-Level Adoption Patterns
| Department | Adoption Driver | Key Metric |
|---|---|---|
| Sales | Revenue Velocity | Pipeline-to-Spend Ratio |
| HR & People | Employee Experience | Retention & Engagement Score |
| Finance | Operational Efficiency | Time-to-Close (Month End) |
18. Funding & Valuation Multiples
Capital markets remain highly selective, prioritizing “Efficient Growth” profiles with strong unit economics over raw expansion, though AI-first SaaS commands a clear 4x funding premium across niches.
| Niche | Valuation Multiple | Details |
|---|---|---|
| Standard B2B SaaS | 4.8x-7.0x ARR | Healthy private SaaS with 20-30% growth, <10% churn; rewards efficiency over scale. |
| AI-Native SaaS | 6.0x-10.0x ARR | Proprietary models/agentic workflows; 4x funding advantage vs. horizontal SaaS. |
| Vertical SaaS | 5.5x-8.5x ARR | Healthcare (+23% YoY), fintech billing (+28%); grows 31% faster than horizontal. |
| PLG SaaS | 5.0x-7.5x ARR | 14% lower churn vs. sales-led; 24-26% faster growth through self-serve conversion. |
| Usage-Based SaaS | 6.2x-9.0x ARR | 42% adoption (up from 28%); 22-24% churn reduction, scales with customer growth. |
| Security SaaS | 7.0x-11.0x ARR | 49-67% growth from AI threats; zero-trust + compliance-as-a-service premium. |
AI Premium Drivers
AI-first startups secure 4x funding versus traditional SaaS as investors prioritize proprietary models and agentic workflows over incremental features. With 92% of successful SaaS now embedding AI as core capabilities, vertical AI solutions grow 3.1x faster than horizontal tools, commanding 6.0x–10.0x ARR multiples.
Key advantages driving the premium:
- ➜ Proprietary models deliver defensible moats (AI coding assistants boost dev velocity 2.3x)
- ➜ Agentic workflows reduce sales cycles by 14% through autonomous value demonstration
- ➜ Outcome pricing correlation yields 12-18% revenue uplift, justifying 10x+ valuations
- ➜ 3.1x growth premium for vertical AI vs. horizontal SaaS establishes category leadership
Niche Multiple Breakdown
Post-2024 market consolidation (35% acquisition rate of smaller players) has crystallized distinct multiples by business model and category differentiation. Vertical SaaS earns 5.5x–8.5x premiums through regulatory lock-in, while usage-based pricing hits 6.2x–9.0x via predictable customer-aligned scaling.
Category-specific drivers:
- ➜ Vertical SaaS (5.5x–8.5x): Healthcare compliance tools +23% YoY, fintech billing +28% from regulatory mandates
- ➜ Security SaaS (7.0x–11.0x): AI threat escalation drives 57% ransomware growth, zero-trust adoption at 65%
- ➜ PLG efficiency (5.0x–7.5x): 14% lower churn, 24-26% faster growth through self-serve conversion funnels
- ➜ Usage-based scaling (6.2x–9.0x): 42% adoption rate, 24% churn reduction aligns vendor/customer growth curves
Market Selectivity Trends
Investors now demand Efficient Growth signatures: sales/marketing spend below 35% of revenue, 40-50% R&D allocation toward AI capabilities, and top-quartile churn under 5% to access premium multiples.
Efficiency benchmarks separating winners:
- ➜ Bootstrapped SaaS: 22% growth but 2.2x profitability vs. VC-backed peers
- ➜ Top-quartile metrics: <35% S&M spend, 40-50% AI R&D allocation, <5% churn
- ➜ Sales cycle reality: 14% extension requires PLG to maintain velocity
- ➜ Acquisition math: 35% of sub-$10M ARR SaaS acquired in the 2024 consolidation wave
The formula remains clear: AI defensibility + usage alignment + vertical focus = premium access in selective markets.
Source: UserGuiding
19. SaaS Failure & Shutdown Statistics
Even in a trillion-dollar market, the mortality rate for startups remains high. By this point, we are seeing a “Great Shakeout” of companies that were funded on hype rather than fundamentals.
- ➜ The 90% Rule: Roughly 90% of global startups still fail, with the “Valley of Death” typically occurring between 18 and 30 months.
- ➜ Top Causes of Failure:
- ➜ Lack of Market Need (42%): Building solutions for non-existent problems.
- ➜ Burn Rate & Cash Flow (29%): Mismanaging capital before reaching the “Rule of 40.”
- ➜ AI Displacement (New for 2026): Legacy SaaS tools being rendered obsolete by integrated AI features from giants like Microsoft or autonomous agents that don’t require a UI.
Most Failed SaaS Categories
High churn rates reveal SaaS categories struggling most with product-market fit, pricing misalignment, and switching friction. Median gross churn hit 8.2% across SaaS in 2025, but certain segments face significantly worse outcomes.
| Category | Churn Rate | Failure Drivers |
|---|---|---|
| Freemium SaaS | 28% | Conversion rates dropped to 2.8%; buyers became more selective post-2024, rejecting unproven value propositions. |
| Horizontal Generalists | 22% higher valuation discount | Niche verticals grow 2.7x faster; generic tools lose to specialized competitors across industries. |
| Sales-Led SaaS | 14% higher churn | PLG companies retain 14% better; complex sales cycles and onboarding fail against self-serve alternatives. |
| HR Tech SaaS | 18% adoption lag | Legacy ERP entrenchment blocks switching; compliance complexity kills momentum despite 73 SaaS apps/enterprise. |
| Non-AI SaaS | 42% slower growth | AI-native solutions grow 3.1x faster; 92% of successful SaaS now embeds AI as a core capability. |
Research Approach Methodology
This report consists of a systematic 4-phase approach aggregating around 12+ authoritative sources into 150+ verified statistics, ensuring all data are current, verifiable, and represent the market reality of 2026.
- ➜ Phase 1: Source Aggregation – Targeted searches (“SaaS benchmarks”) identified tier-1 research from Fortune Business Insight, EVS, Vena, First Page Sage, Everstage, Threadgold Consulting, etc.
- ➜ Phase 2: Data Validation – Each statistic was cross-verified against recognized trustworthy sources. Applied quality filters for 2025-2026 publication, sample size >500.
- ➜ Phase 3: Metric Normalization – Converted units (monthly/annual churn, ARR/MRR) and weighted by recency and authority. Created benchmark tables (funnel rates, vertical CAGRs, sales cycles).
- ➜ Phase 4: Citation Audit – Direct source validation across all 150+ claims now carrying direct, crawlable documents.
Conclusion
To win in this digitally competitive SaaS statistics and trends dominated era, a company must be more than just “cloud-based.” It must be efficient, AI-native, and organic-first in its growth strategy. The data is clear: companies that rely on expensive paid acquisition and bloated manual teams are being outperformed by lean, automated competitors.
Summary of the 2026 SaaS Playbook:
- ➜ Optimize for NRR by expanding within your existing base.
- ➜ Leverage Agentic AI to reduce your operational cost-to-serve.
- ➜ Build a sustainable organic engine to keep your CAC low and your LTV high.
Wanna find out the 26 proven link-building strategies
top SEO experts are using?
Let’s read and kickstart the growth with Linkscope today!
Join TodayFrequently Asked Questions (FAQ)
What is a good churn rate for SaaS in 2026?
For Enterprise-level B2B SaaS companies, a good churn rate is less than 1% per month or 5-7% per year. For SMB-level SaaS companies, 3-7% per month is good. And over the year, this rate would range anywhere between 36-76%.
How many SaaS apps does a mid-sized company use?
Currently, mid-sized companies, with 750 to 2,999 employees, are using an average of 192 individual SaaS apps, and companies with 3,000 to 9,999 employees use 152 apps. This significant increase is compared to smaller organizations due to decentralized departmental adoption, lacking centralized IT management.
What is a healthy NRR for enterprise SaaS?
For established businesses, the threshold should be at least 120% or higher. While for startup SaaS businesses, this can go as high as 140%. Enterprise-level SaaS should aim for >110% to 120%+ to demonstrate efficient, sustainable growth.
How fast is the Vertical SaaS market growing?
The Vertical SaaS market is currently growing faster than the horizontal SaaS market, with an approximate growth rate of 2x that of the horizontal market. The growth rate is 18.4% CAGR for overall SaaS till 2032.